


Midnight Macro Note: Standing on K2
A rolling discussion on technicals, internals, and risks as we look around from the 2nd most overvalued market on record. Navigating peaks is a difficult game, but we're here to do just that.

Good Friday evening MacroEdge Readers & Community,
This evening we’ll discuss technicals, internals, and risks as we navigate ‘standing atop’ the second most overvalued on record - measured by CAPE - and what various market signals are telling us about risks to the lofty valuations that screamed higher in record-breaking 2023 and 2024 years. Thus far, markets are having a very different start to their year than the previous 2 years - and this warrants paying attention to given where valuations, risks, and internals stand.

We’re starting the year on a sharply different note than the high-flying years of 2023 and 2024. Access Ozone below for two weeks now:
(Pictured below: K2 - ‘World’s Second Highest Peak & Deadliest Mountain’)

Why K2? Market Discussion
Ironically, as the world’s second-highest peak, K2 stands as the most deadly. Killing far more than Everest has in the last 100 years, the period by which both mountains have been conquered with more frequency by mountaineers. Why the metaphor to K2? In the K-shaped economy of today, we are much more reliant on asset prices staying elevated for the economy to continue to function - as the top K is what continues to propel our economic engine forward - even at the expense of growing inequality and the record affordability gaps we see today… Thus the modern economy is a variation of K2 - the asset class and the non-asset classes - which means that minor events to the top of the K present a greater risk to the entire economy than in past times as the economy was more diversified. Our economy & the markets are very much like K2, and we continue to push for more even as the oxygen thins at current altitude.
One example mentioned in a discussion I was in today noted that just 1 in 5 renters in the Dallas-Fort Worth metroplex make >$100,000 - the current income required to qualify for the most basic starter home in the area… case in point.
The Risks of ‘K2’
While the risks of summiting K2 itself are different than the K2 market and macro risks, we can draw similarities between the two.
The follies of the Fintwit & ‘2023/2024’ era investor is that they are operating on a recency bias of outsized returns, ‘free money’, and an economy fueled by speculation and - at the core - gambling. A lot of what we’ve seen in the Pets.com markets of today is no different than what we’ve seen in past market bubbles, such as the 2020- 2021 market when unprofitable technology and ETFs packaged with garbage - like ARKK - ran to all-time highs as Powell overheated the printer, and eventually ran out of ink when CPI began to go from somewhat problematic to mildly destructive.
Much of that speculation of the last two years has fallen into the cryptocurrency space - but we also saw it in AI names, semiconductor companies, in Tesla, Palantir, and elsewhere. When cosmetologists & tow truck drivers are quitting their day jobs to speculate in the markets or start offering up stock tips, there’s more to investigate. In attending a ‘crypto conference’ last week - men who started ‘trading’ crypto were somehow subject matter experts on an up only market and we’re charging almost $500 for attendees to join their group for crypto investment recommendations.
While markets, money supply, and inflation in our debt-fueled society undoubtedly rise over time - this doesn’t mean that there aren’t market cycles or risks - even with a Fed that pulls at the stops at nearly every first sign of pain. Even in the 2021 era - when investors thought the same thing - we still saw nearly a 40% correction on the Nasdaq over 2 years, and complete annihilation in many of those unprofitable names mentioned above.
Cycles in things like technology can be extremely long - take the Nasdaq for example - which took 14 years to recover its nominal highs from the peak of the 2000 bust.

Valuation - K2 Levels
K2 makes sense - for the economy, and for the markets - today - as we discuss time & time again, we’ve reached our second-highest valuation levels on record, and that’s problematic. While there is no market timing instrument when analyzing risk this way, we can compare past examples of valuations becoming as disconnected as they are today for precedent on where things may go. This is why we don’t need to forecast utilizing valuations alone and can utilize other tools to do just that. Today, CAPE fell back below 38, a level which it has struggled at tremendously in the modern ‘QE’ markets:

Should we care at times when it is not 38 but still elevated? Yes… but in times of great excess like today and with a more involved Fed in the economy, we can conclude from the ‘modern market’ periods as to what might happen to PEs going forward. At the very minimum, a reversion to the ‘modern mean’ would mean considerable compression on tech (COMPQ) and the broader indices. Note that this excess occurred even though it lacked complete participation from the Russell 2000 and to a lesser degree - the Dow.
The ice that the market is walking on is getting thinner for now, and unless retail investors continue to pile in, the upside will become more difficult to achieve with current headwinds.
Technical Deterioration
Today we find ourselves atop K2 -

That doesn’t mean there’s not a higher peak - in Everest - there is - but our only other precedent for positive forward returns from valuations at these levels is on a 6-month basis with the 1999 blowoff… which was truly a blowoff. The Nasdaq increased 80% in just 6 months from October 1999 to March 2000. Right now, with the decline in internals, a repeat of that isn’t looking particularly likely. Above, note the Syndrome 74 signal, which indicated right before the bust in 2000, late 07, 2018 before Volmageddon, late 2019 before the COVID flash crash, late 2021, July 2024, and this week… While that covers a longer-term view, we’ll break down the daily and weekly timeframes below for the Nasdaq, S&P, Russell, and Semiconductors…
Nasdaq —
Daily timeframe below, bearish divergence and below 21,000 will likely mark the end of the 2023-2024 ‘bull run’.

Below, weekly timeframe, shaping up a lot like late 2021:

S&P 500 —
Daily timeframe below, bearish divergence
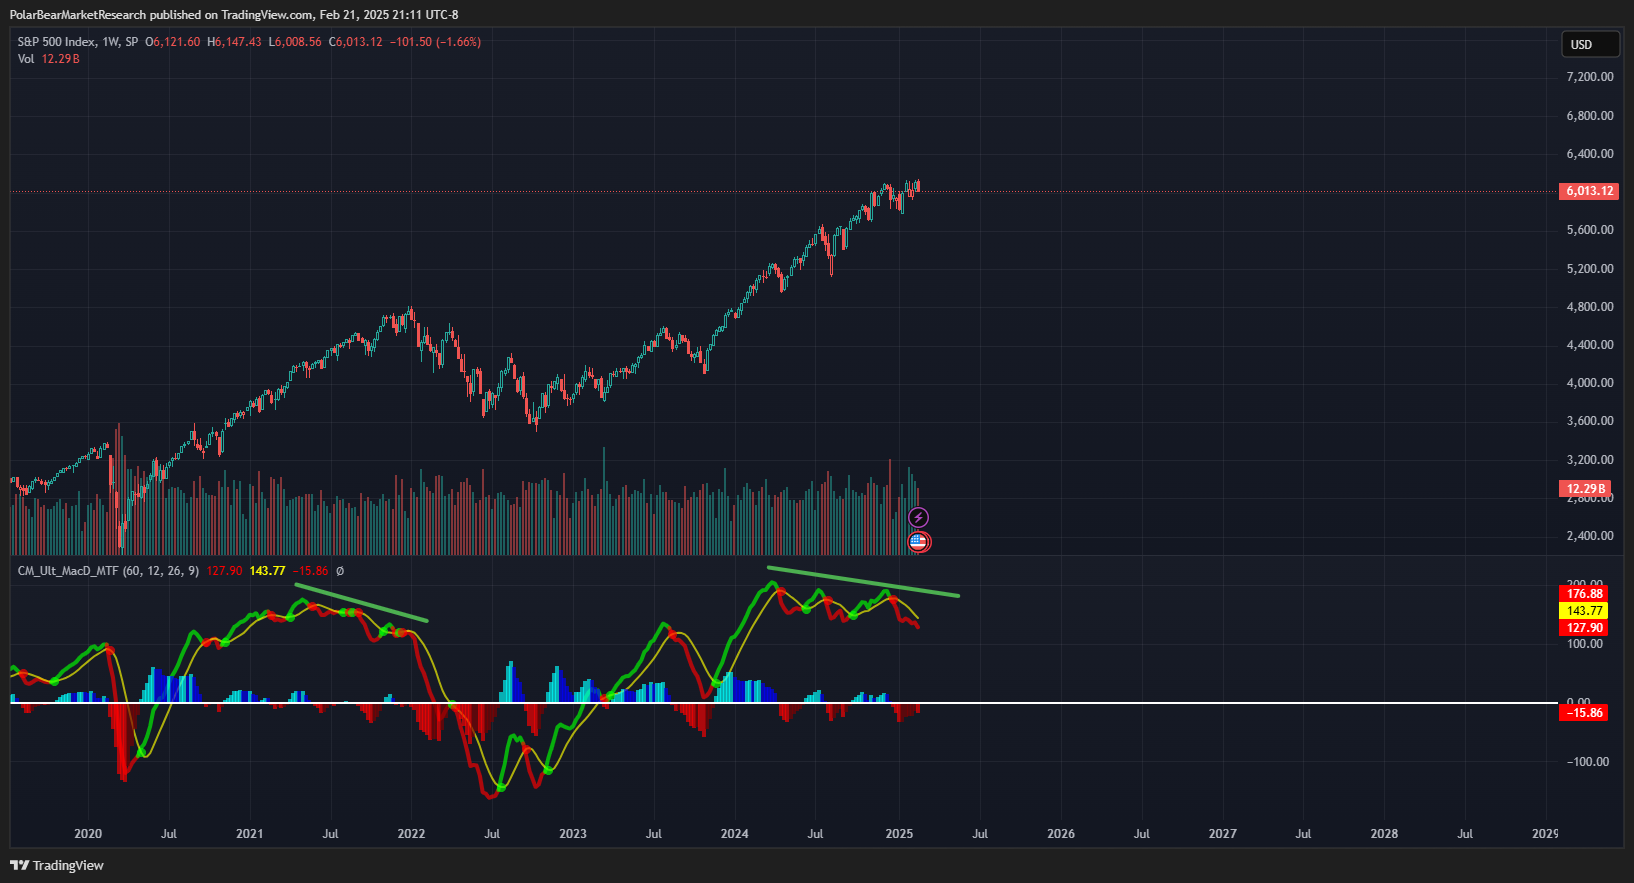
Below, weekly timeframe, shaping up a lot like late 2021

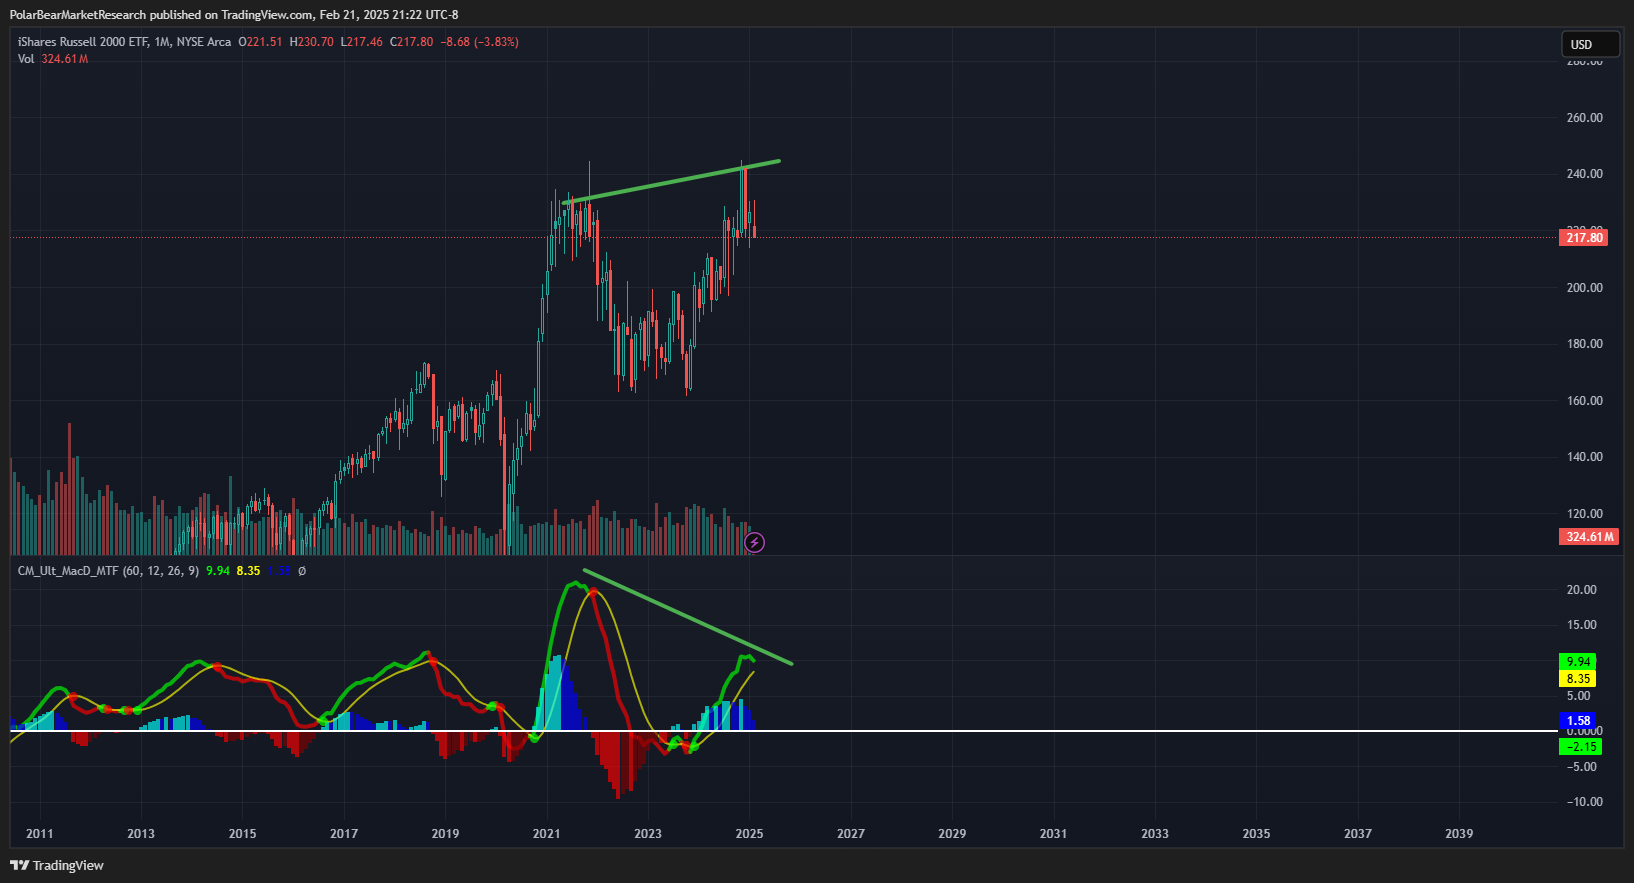
Russell 2000 —
Monthly bearish divergence (below)
Semiconductors —
Looking very similar to the top in 99-00:

Weekly:

Nvidia could be the fire under a bigger move in semiconductors going forward…
Note that divergences can take extended periods to play out - months & even quarters/years depending on the timeframe. Evidenced it above by the 2021 cycle, in which technicals worsened during the entire year, that didn’t actually matter until late 2021 when things finally cracked.
Earnings Season Follies
This earnings season has been very disappointing, and when names like Walmart are warning about poor guidance for 2025, worsening guidance & EPS are dampening expectations for the year already. In the last week of the month here - we’ll get to hear from Nvidia & several other ‘high-flyers’ that drove much of the gain we saw in 2024. Nvidia has been trading flat now for almost a year, and the growth story faces further headwinds as we’ve seen in other giants - including the Mag7 this earnings cycle…
Employment and Inflation
As part of the ‘Trump Risk Matrix’ - employment and inflation remain two core risks under the current admin. Employment has weakened further this month as Trump embarks on rampant cost-cutting in the federal government - which I chalk up to wanting to reduce the 10Y:

On the inflation side of things - we saw 5-Year UMich Inflation Expectations hit their highest level since 1993 - while 1-year expectations jumped to almost 5%.
For now, that’s a stagflationary trend…
Other Risks
Speak for themself… Watch the Yen, other foreign currencies, Japanese inflation, and more. We’ll talk about this more this weekend.

Have a great weekend and we’ll talk on Sunday.
— Don