
Weekly Macro Note: K-Shaped Problems, Stalled Technology Equities, Portfolio Strategy Update, and More
In this Weekly Macro Note - we discuss continued problems in the K-shaped economy, highlight the continued distributive patterns in equity markets, provide a portfolio strategy update, and more.

Don Johnson (@DonMiami3), Chief Economist
Good Monday evening MacroEdge Readers and Community,
This is the last shift in the Weekly Macro Note to a Monday timeslot until the next market holiday in early April. Hopefully you all had time to catch up on the Redeye Macro Note, and we covered a lot there. This evening builds upon that, and we’re going to discuss everything from the explosion of the K-shaped economy narrative, look at the bond market in more depth after the abysmal employment report, talk about our global bubble gauge readings, and much more.
This evening, futures are off to a rather tepid start, although coming out of the holiday that likely holds little bearing for the direction of the week. Most notably, we have not yet seen any recovery or bounce higher across the board in the cryptocurrency space. As we’ve seen several times over the past 18 months, crypto is likely a precursor to equity market action, and unless there’s any major move higher in things like Bitcoin, expecting any major move higher in equities seems quite unlikely, even though off-the-wall speculation may continue in single names and sectors (like AI). Out of Japan, we got their latest GDP, reading which came in soft - the Japanese economy remains weak - and their financial markets have become completely untethered from reality - in a more narrow bubble, but similar in style to what we saw in the Nikkei in the late 80s in Japan. Elsewhere in the world, as I highlight below, I continue to monitor our four key global bubble gauges for signs of cracking. While US markets have largely stalled and slowed for the past six months, these global indicators have continued to flash record levels of risk (and risk-on) as domestic populations have piled into financial markets.
As I highlighted in the employment report and recap in the Redeye Macro Note, the bond market did not buy the headline employment figures with the 10Y again nearing 4%. I would be cautious about going overweight on bonds now until macro data weakens further. While the government is shutdown again, this is a limited-in-scope shutdown impacting TSA/Customs/and other DHS capacities - rather than the Bureau of (supposedly tracking) Labor Statistics and the Bureau of Economic Analysis. I have my fair share of criticism now of all government agencies, given the lack of quality & accuracy of the data… and I explained some of that in the previous Redeye Macro Note.
If you haven’t yet joined the MacroEdge Ozone tier through Substack, all memberships are now available exclusively through our Substack. Over the past three days, we made the Top 75 list for trending in Finance - and I would like to put us in the Top 10 list permanently. Ozone memberships - which include all of our data, reports, research, and more are available to try for 7 days through Substack:
… the random chart of the week - absolutely [no-one] is paying back their student loans:
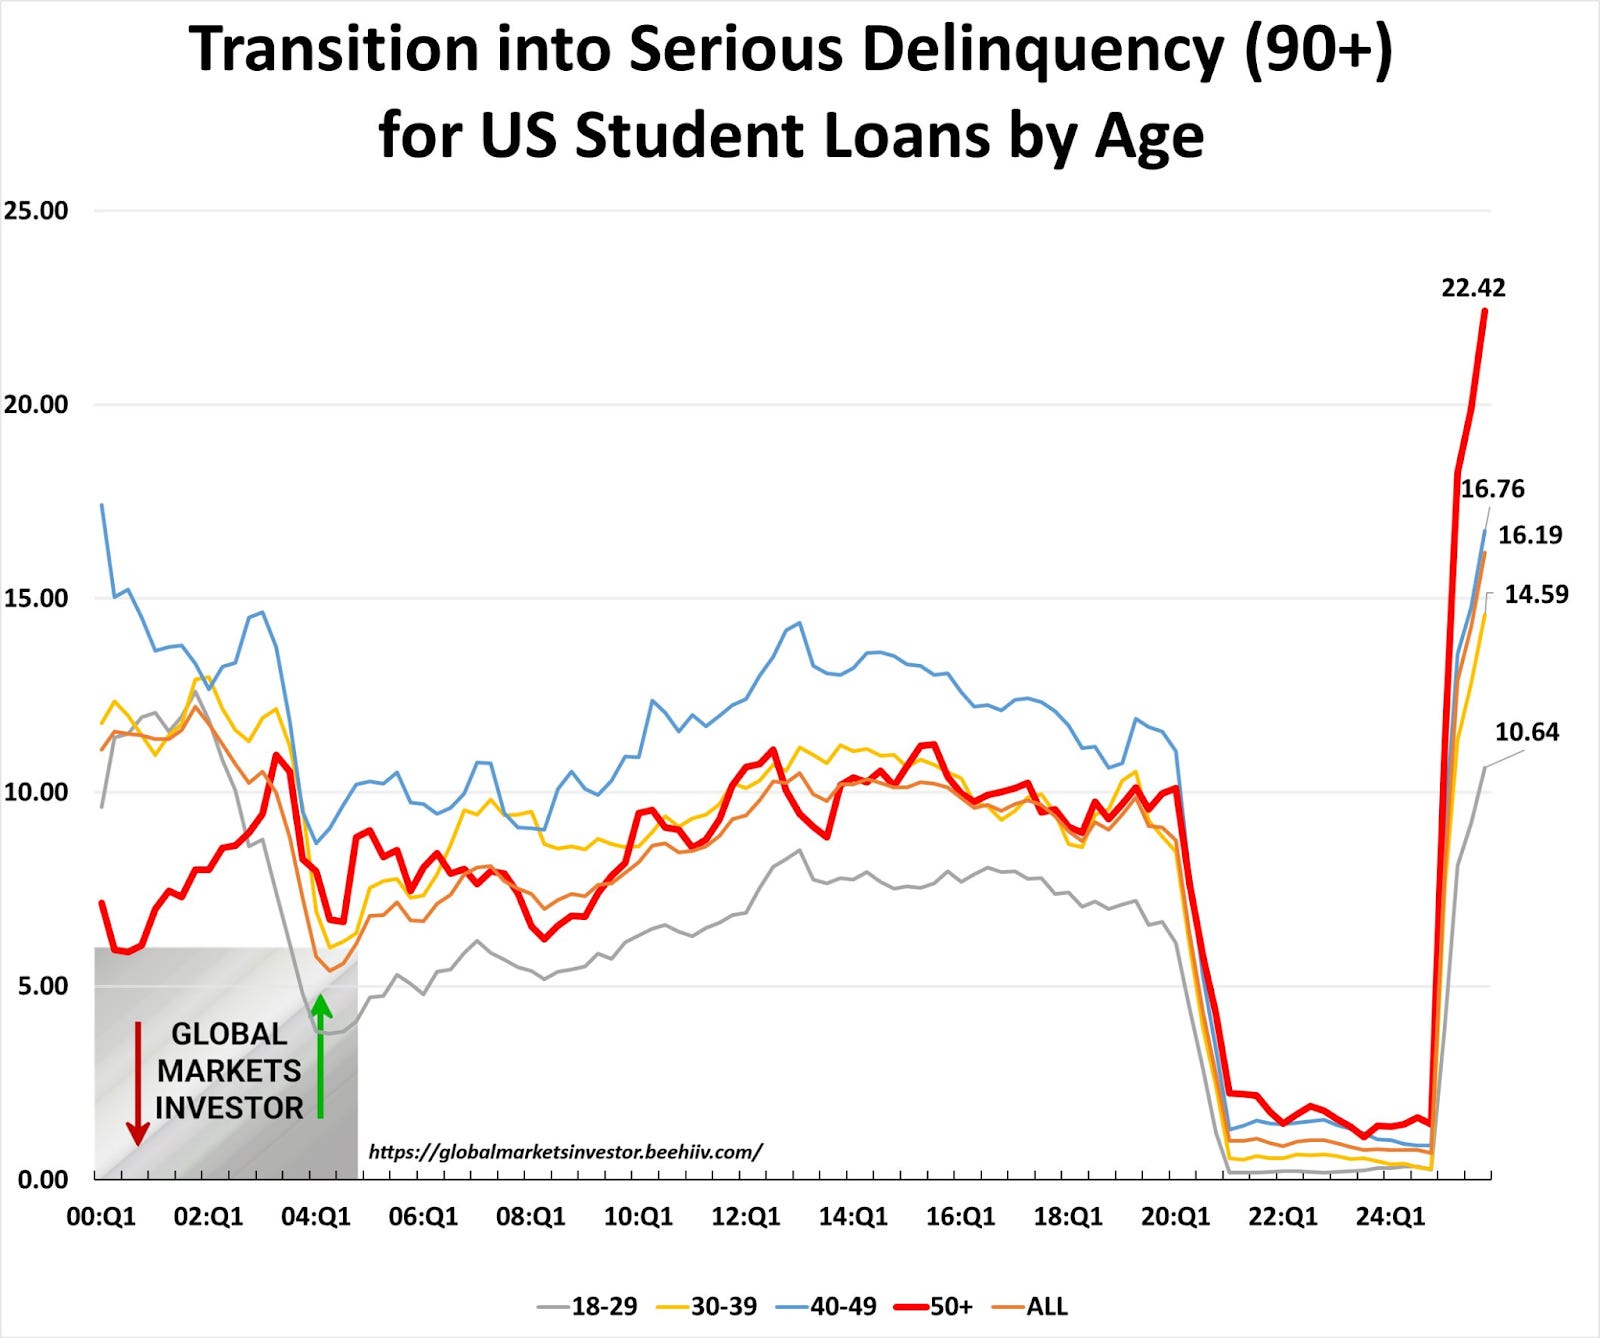
The 50+ age bracket now has hit an almost 25%!... yes, 25% delinquency rate on their student loan balances.
Macro Week Ahead
This is a fairly light week from a macro data perspective. While
Tuesday: Empire State Mfg., Advance Retail Sales
Wednesday: Durable Goods, FOMC Minutes
Thursday: n/a
Friday: Japan National CPI, Q4 GDP (USA), PCE
Project South Africa Revisited: The i-Shaped Economy
One of the thematics I am excited to revitalize was our ‘Project South Africa’ series, which originally began when we started this Substack. In this series, we’ve highlighted many devolutions underway in the United States - and really moved the curtain to the side on things like the widening wealth and income gap, problems with housing costs, and much more. All of this is contributing to a society in which we’re seeing our infrastructure degrade, record high income to mortgage cost ratios, record rent prices, and a situation, that in my opinion, looks a lot like what Japan faced in the lead-up to their lost decade.
This image from Brazil highlights the growing dichotomy quite well:

While we can continue to extend (and mostly pretend) to keep things on the tracks - the math, particularly for young income earners in the United States, is at a point where I see a much steeper drop in the birthrate coming in the next 5-15 years, and an increase in young graduates moving back in with their parents after graduation. In the city I am visiting this weekend (St. Pete, Florida), as one example, the average rent in the city is $2,200 a month for a 1-bedroom apartment, while the median income for earners across the entire spectrum is $48,000. I visualized this for this particular case:
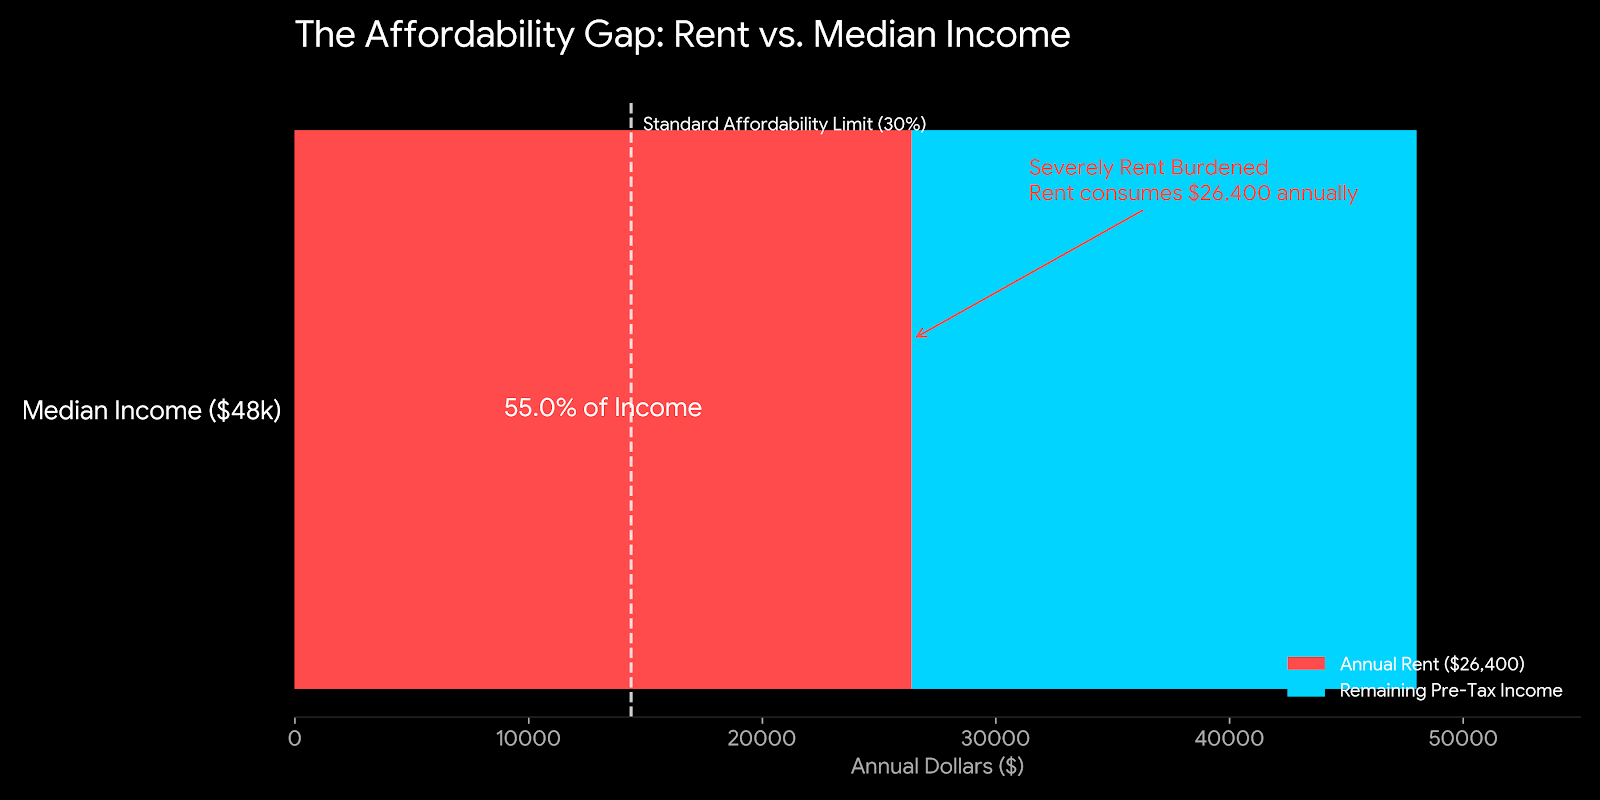
The situation in Tampa is really no better, and across Florida (and the United States), these trends are concerning. I wanted to reintroduce this theme because it is one that is very relevant to the i-shaped economy that seems to be accelerating with a faster pace now, and it is one that I will continue to mention over the course of the year now…
[Continued below: a look at bonds and yields, stalled technology equities, our global bubble gauge readings, Dow=50K… ignore all else?, Trident update, Portfolio Strategy update, Spamflation, and more]. Subscribe below for full-access.
A Look at Bonds and Yields
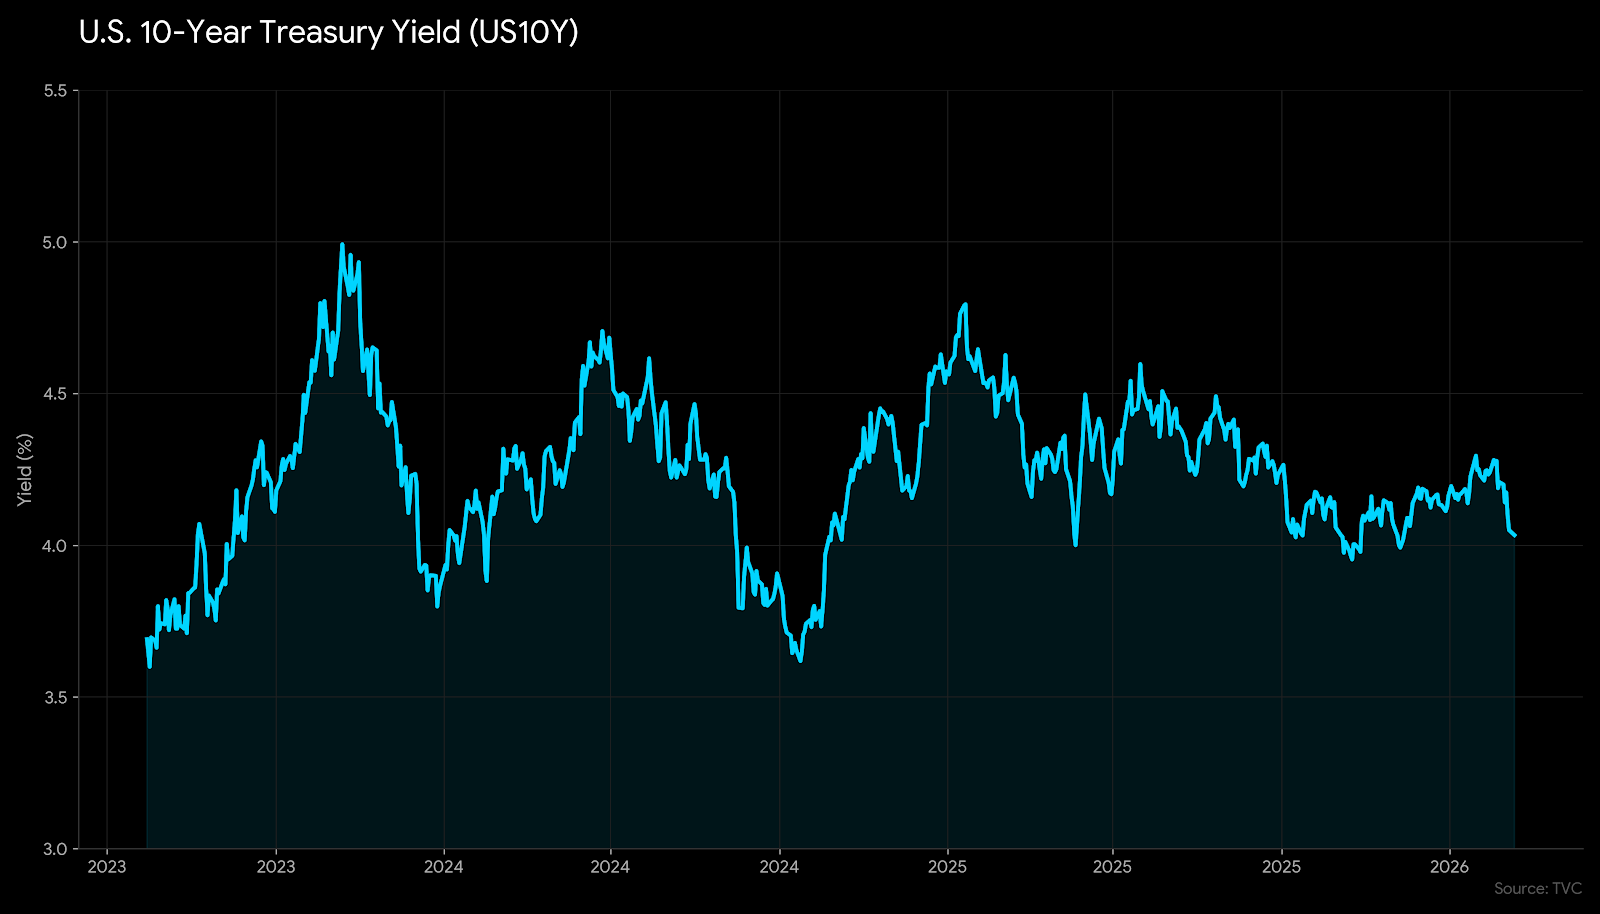
Bonds have recently caught a bid off of the lows. The whole ‘golden age’ thing isn’t really being believed by bonds across the board. The 10Y yield is almost back below 4% this evening, and the brief Powell spike seems to be fading. While some Fintwit economists are highlighting a cyclical nature of the economy being dead in the world of perpetual bailouts, I’d take the 10Y below 3.8% as a warning signal about the cyclical sectors we are often highlighting.
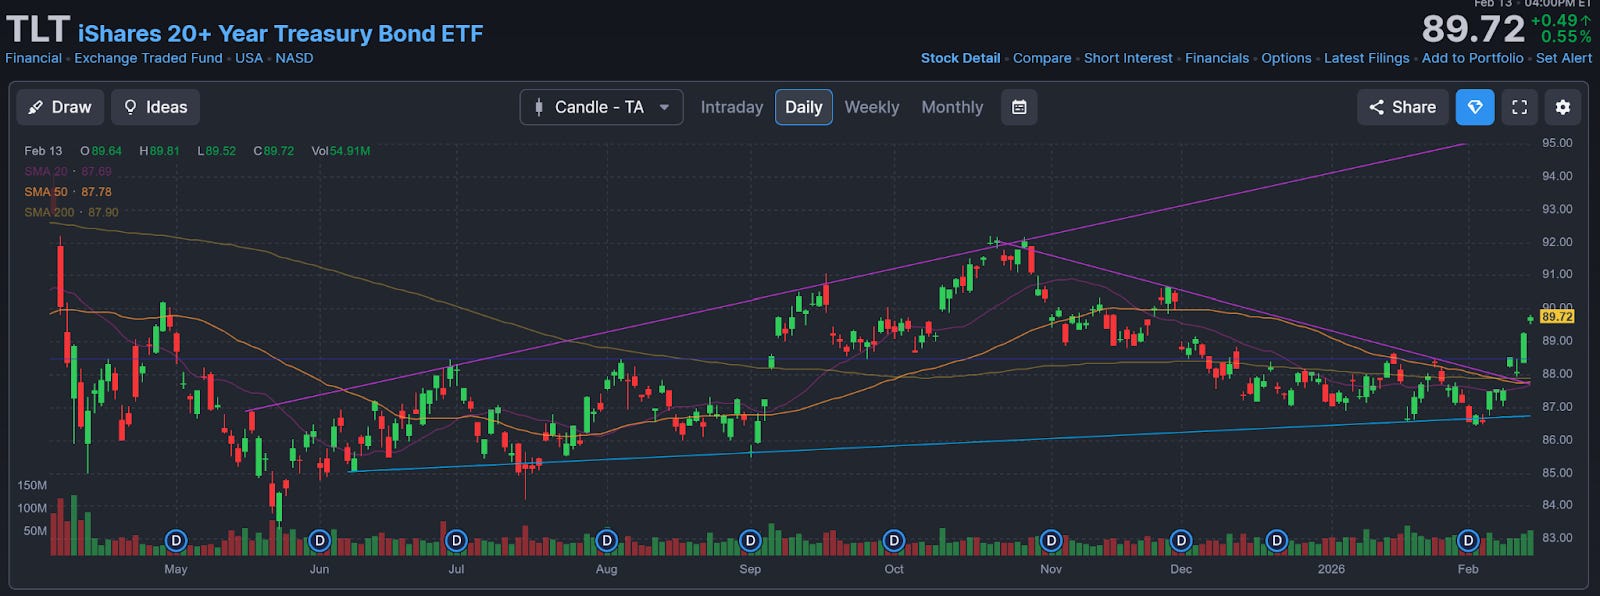
TLT -> above all moving averages again after a push higher last week
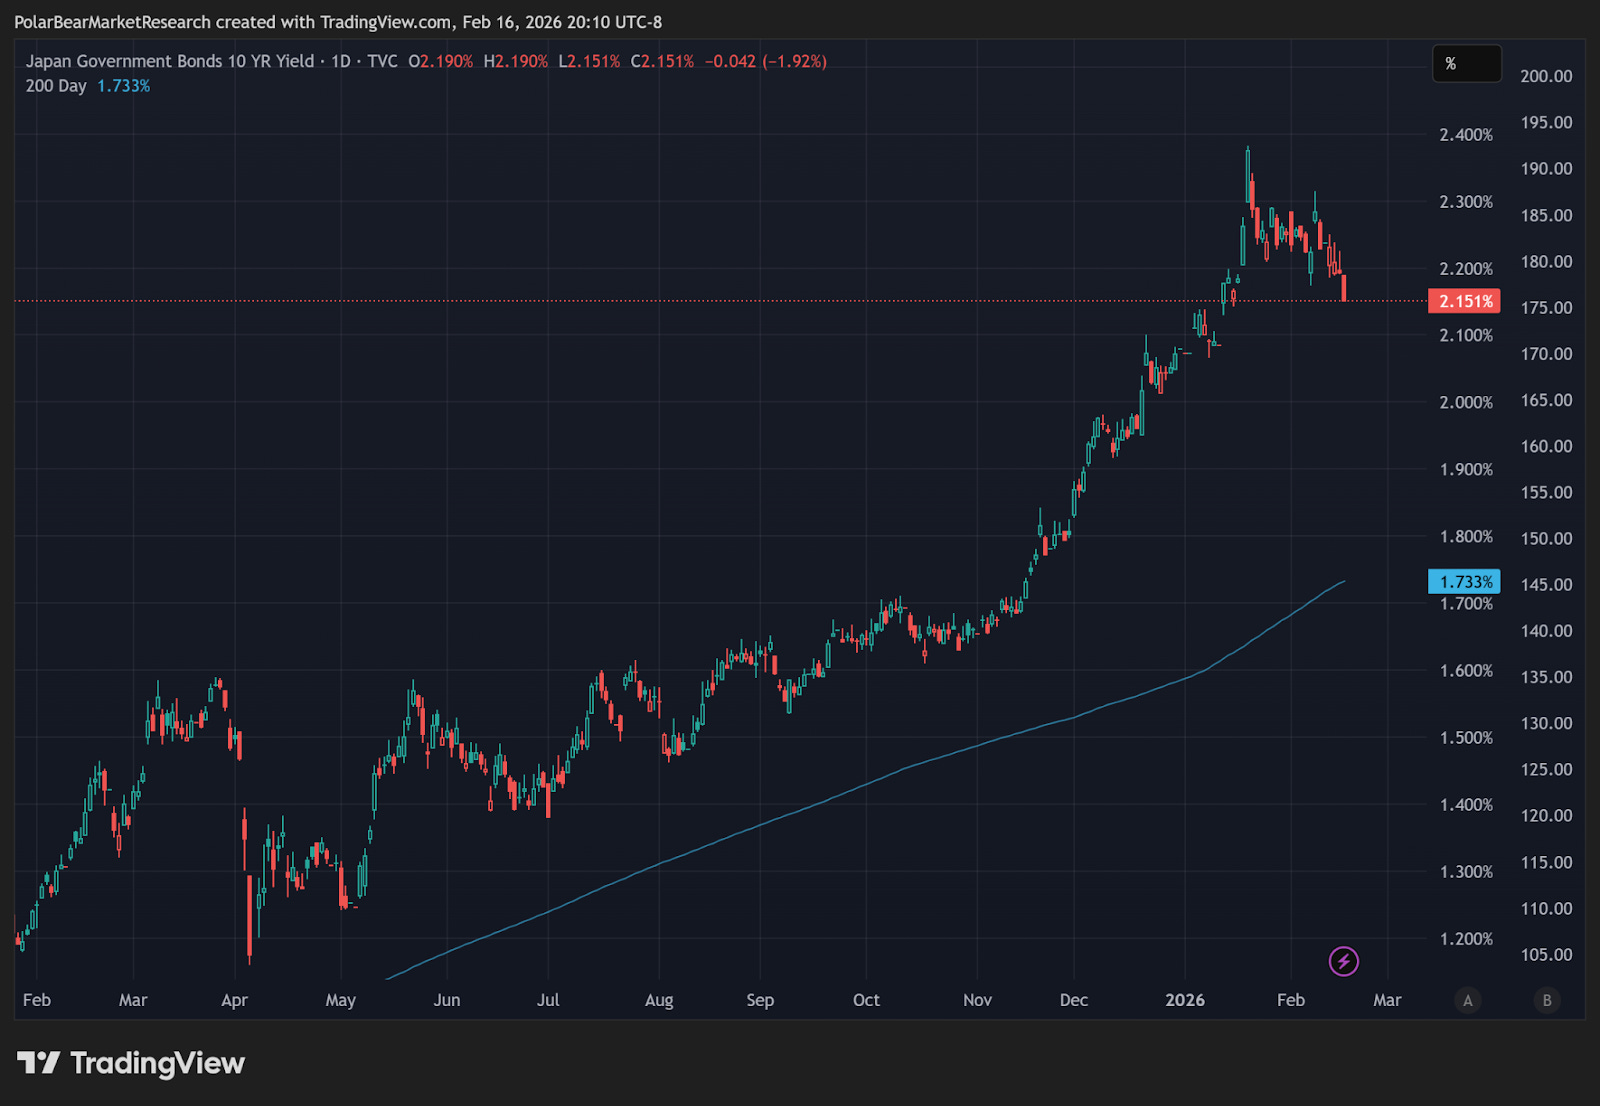
The level on the 10Y I would be looking for is 3.8% as a more valuable warning signal - but for the time being, wait for further data before that occurs. In Japan, yields are also starting to move lower, signalling that high yields may have finally slowed things enough for the time being to pull them back:
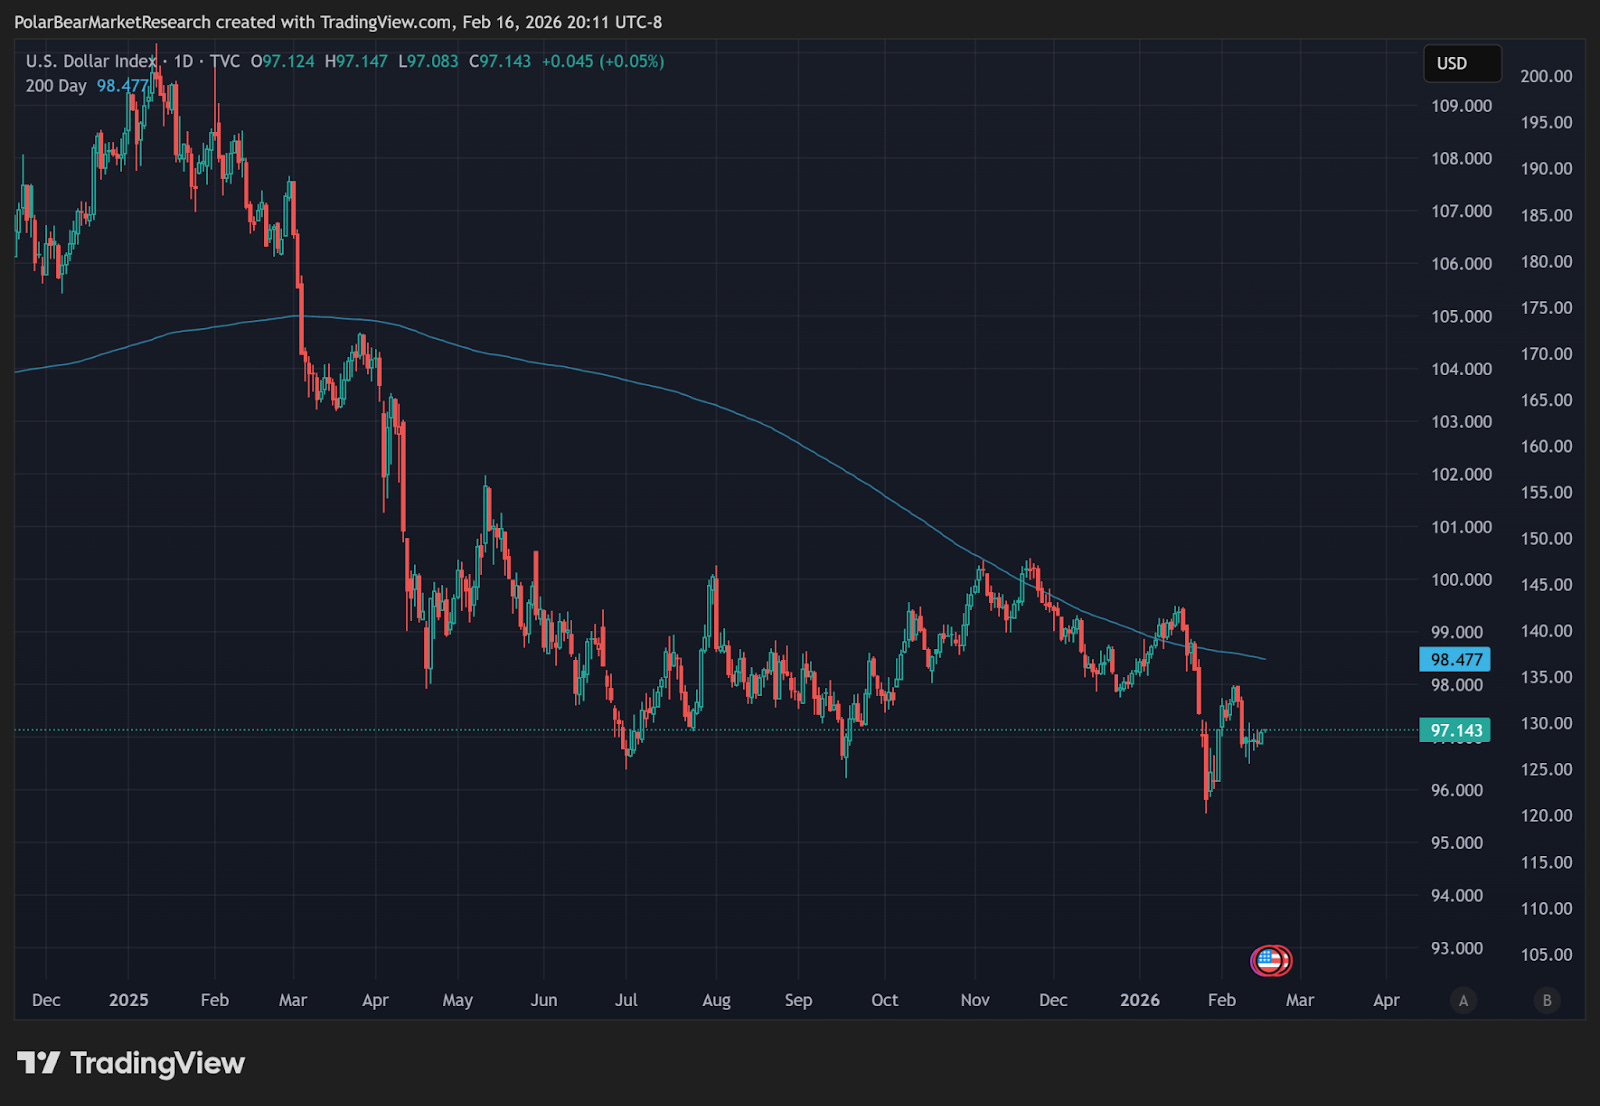
The Dollar Index (DXY) also appears to be forming a base as well:
Stalled Technology Equities - MAGS & NVDA Struggles
Technology equities continue a broad distribution pattern that we’ve now been discussing since the beginning of the year. While this doesn’t signal an imminent cracking - it’s something to keep an eye on as it doesn’t have the characteristics of accumulation.
Our Global Bubble Gauge Readings are off the Charts
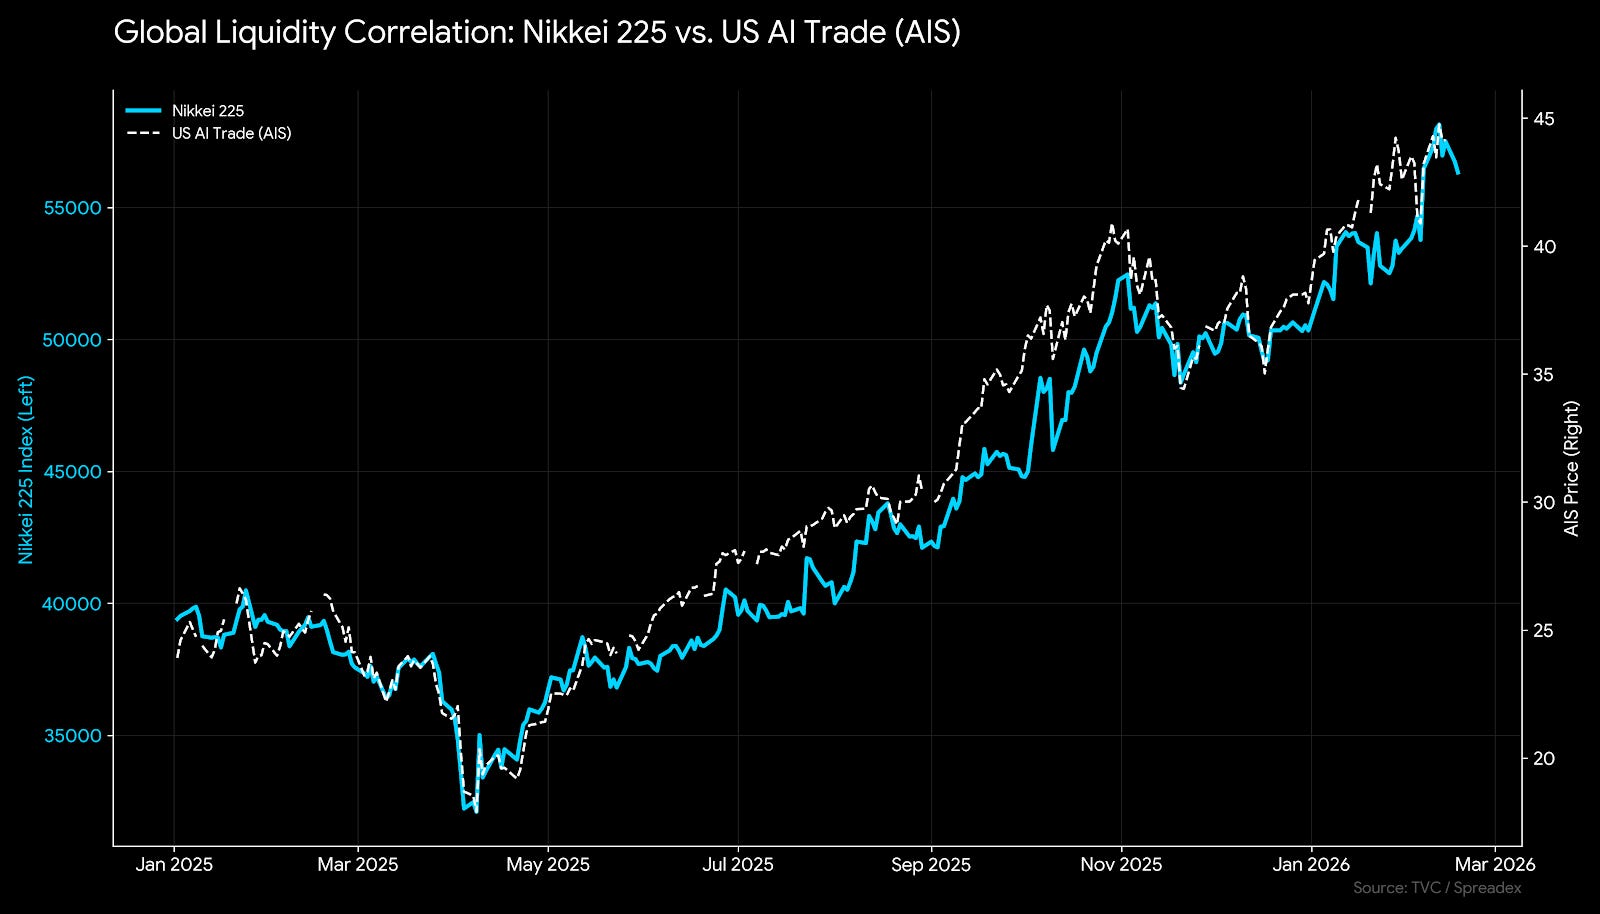
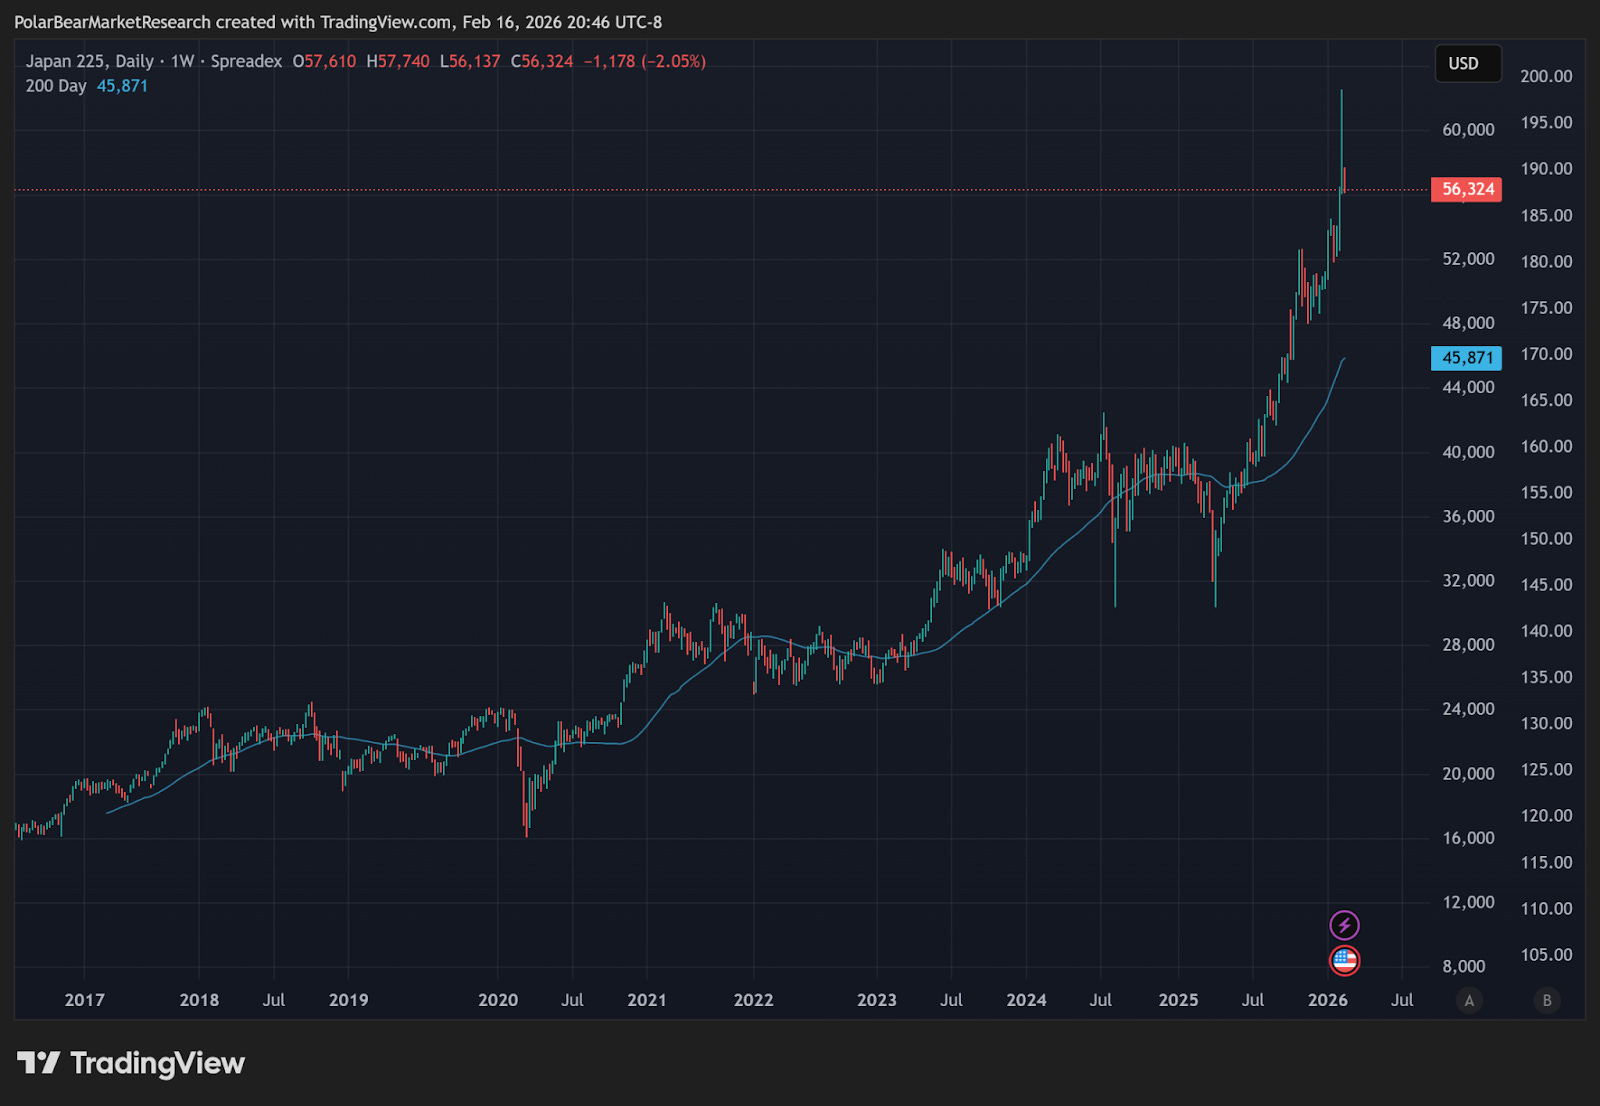
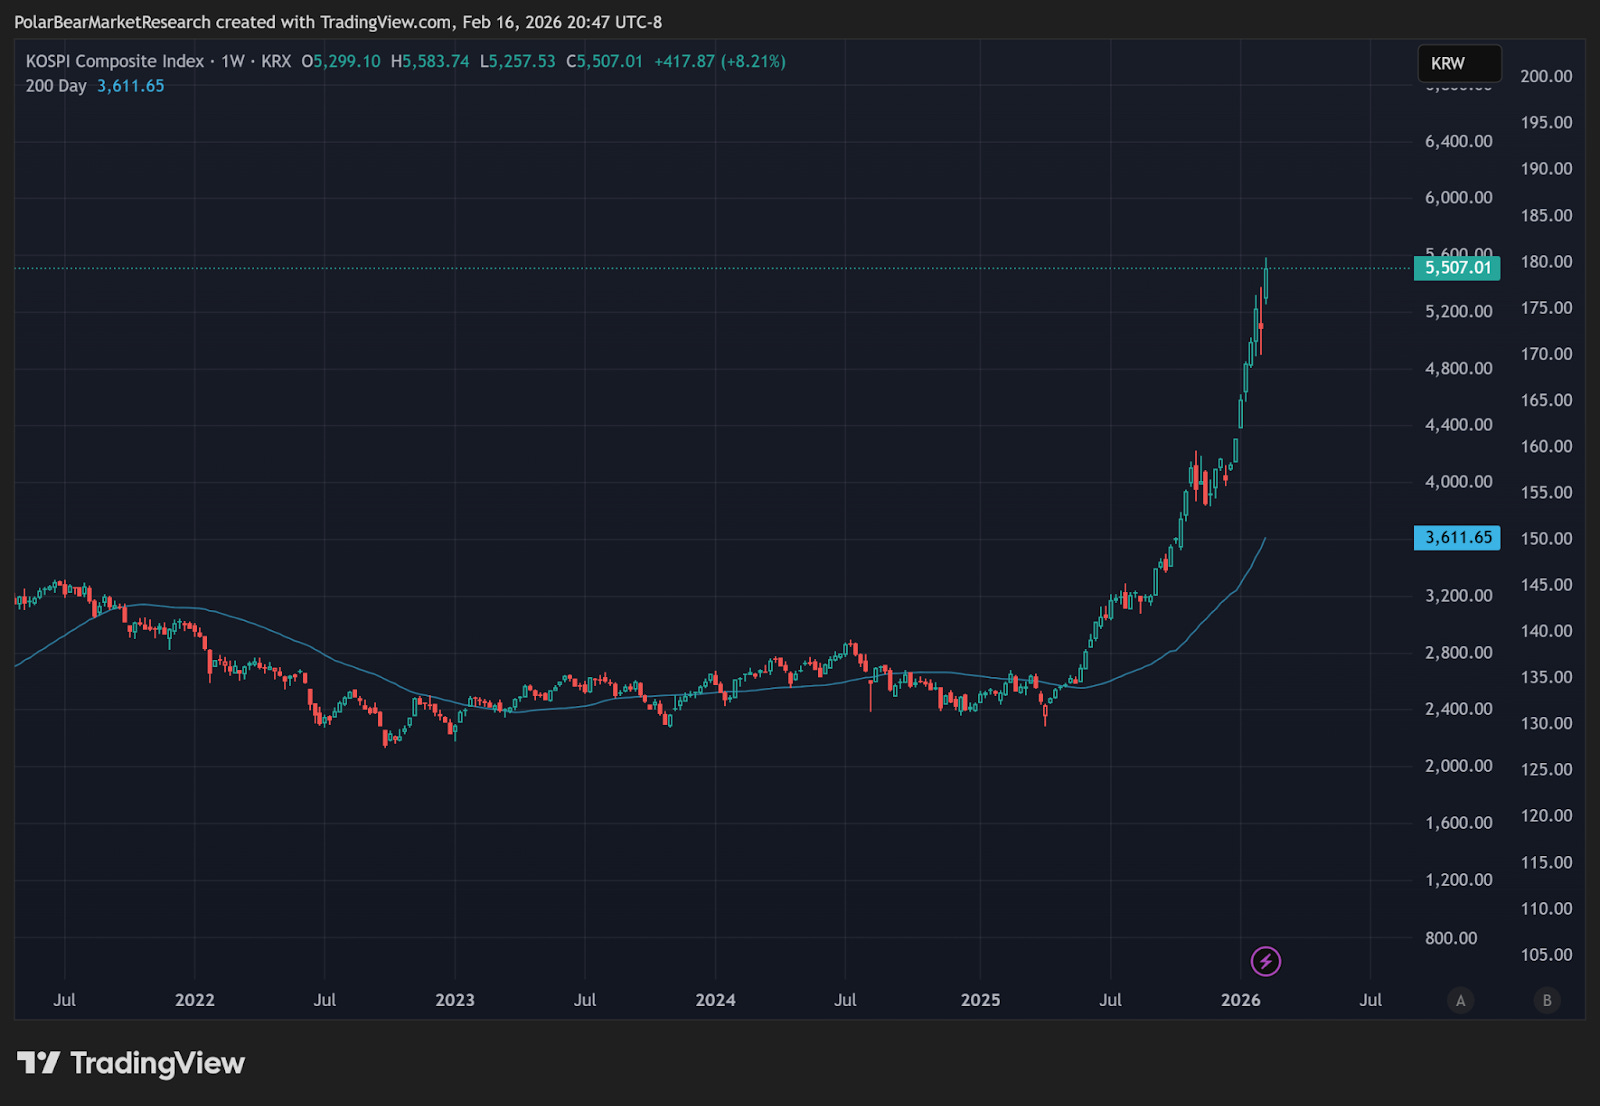
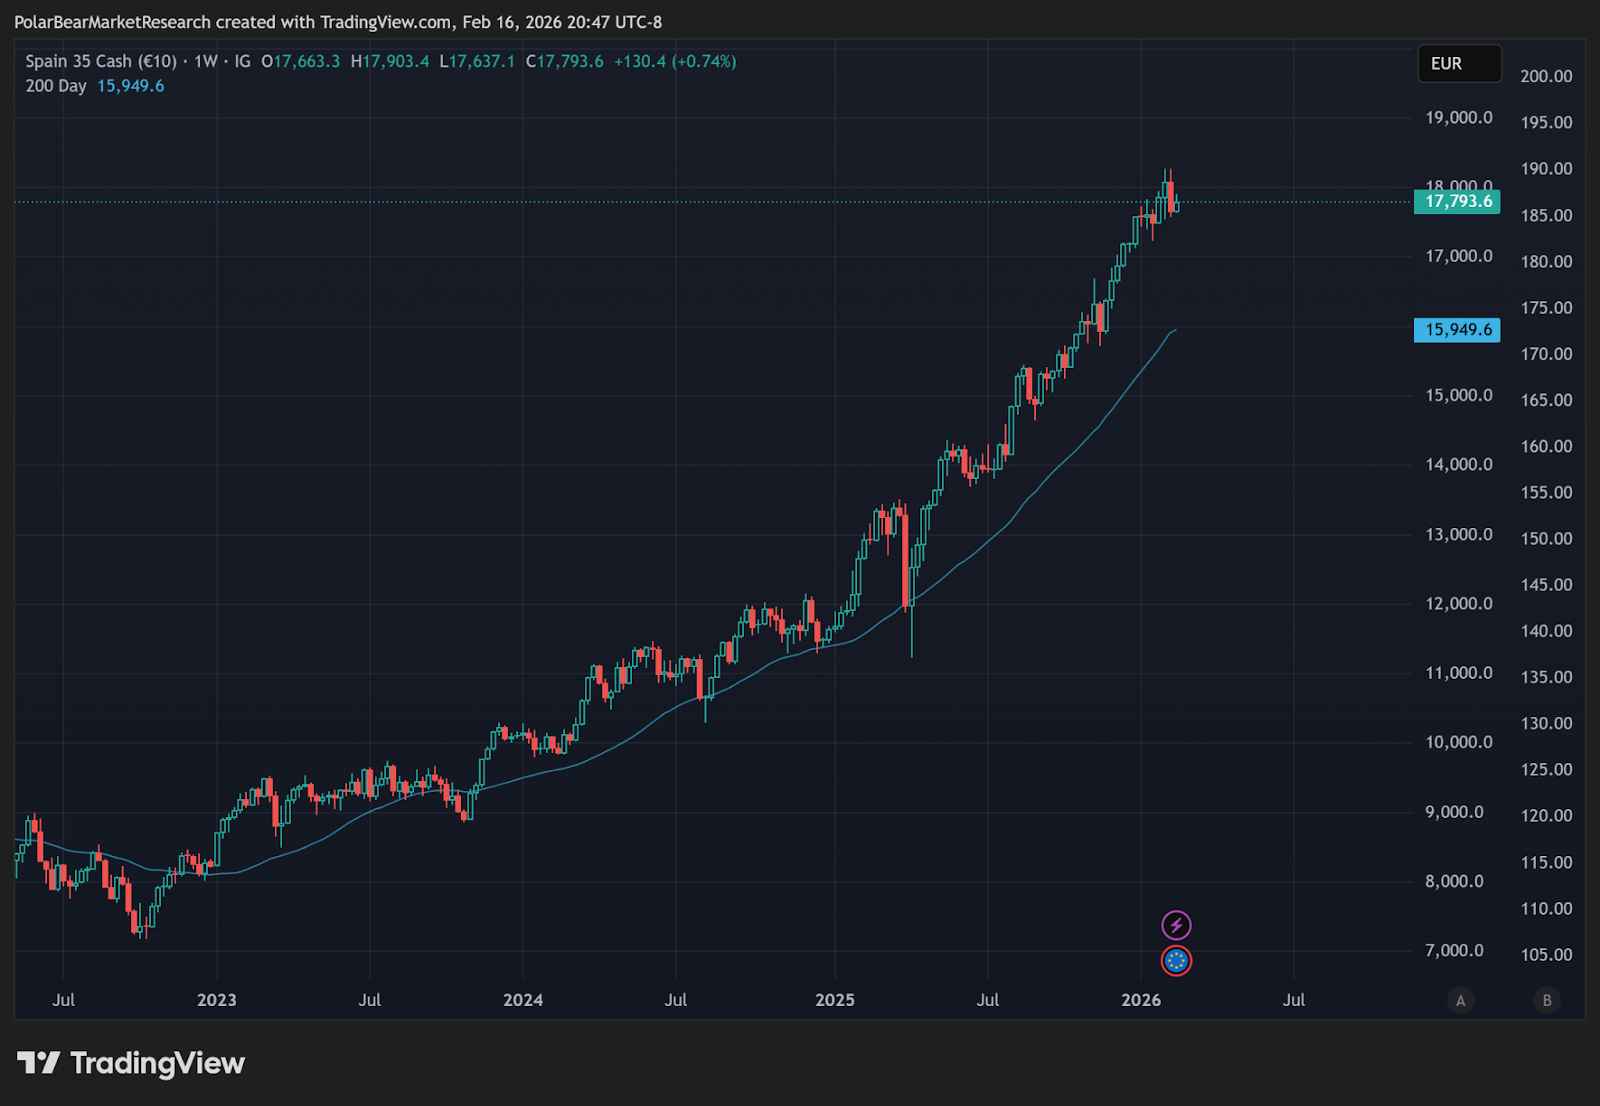
Our global bubble gauges across the board continue to flash warning signals - while these aren’t quite rolling over, I continue to utilize them for their relevance to the entire cycle + AI cycle. If you look at the Nikkei and KOSPI - I’ve pointed out the similarities that these global indices have to the AI bubble domestically in the United States… There are many reasons for this (things like the carry trade and Japanese financing), but there really is an all-one-trade thematic in data centers & AI versus East Asia.
Nikkei v US AI trade:
Nikkei:
KOSPI - arguably the worst of them all…
Spain IBEX35:
Using as our most direct risk-on/off signal for the Nasdaq:
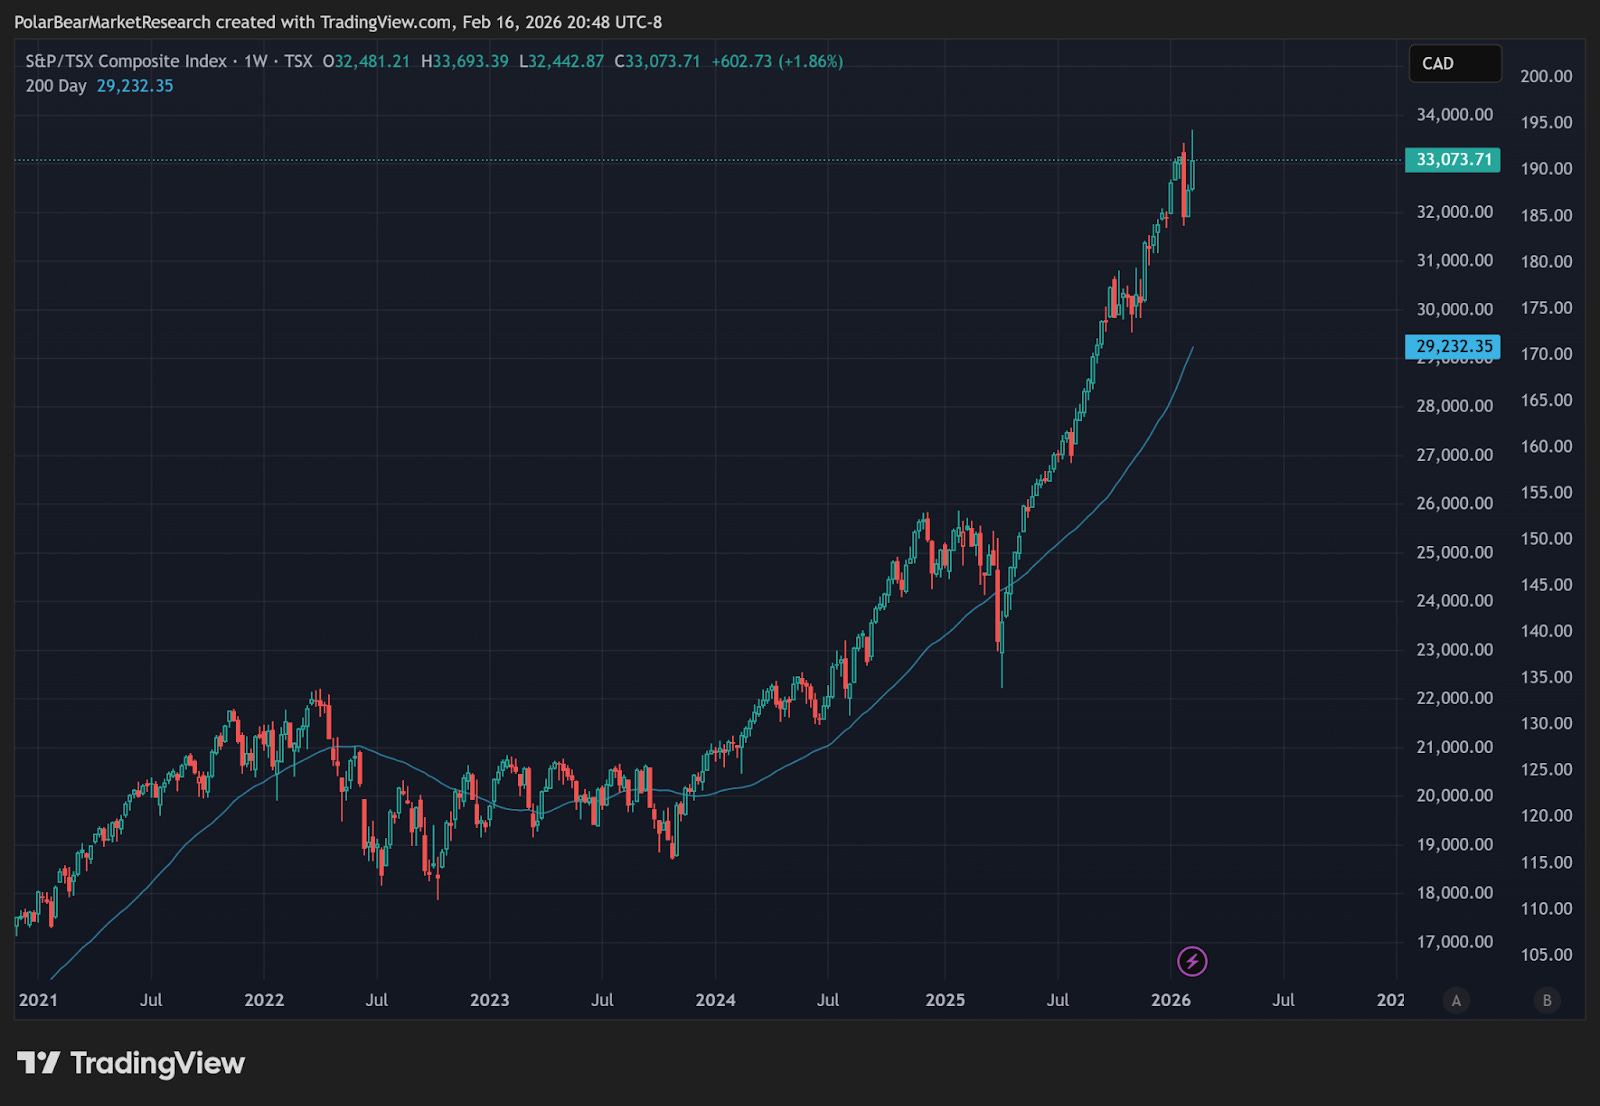
S&P Global Canada TSX:
Shiller CAPE in the US is at its second-highest level ever:
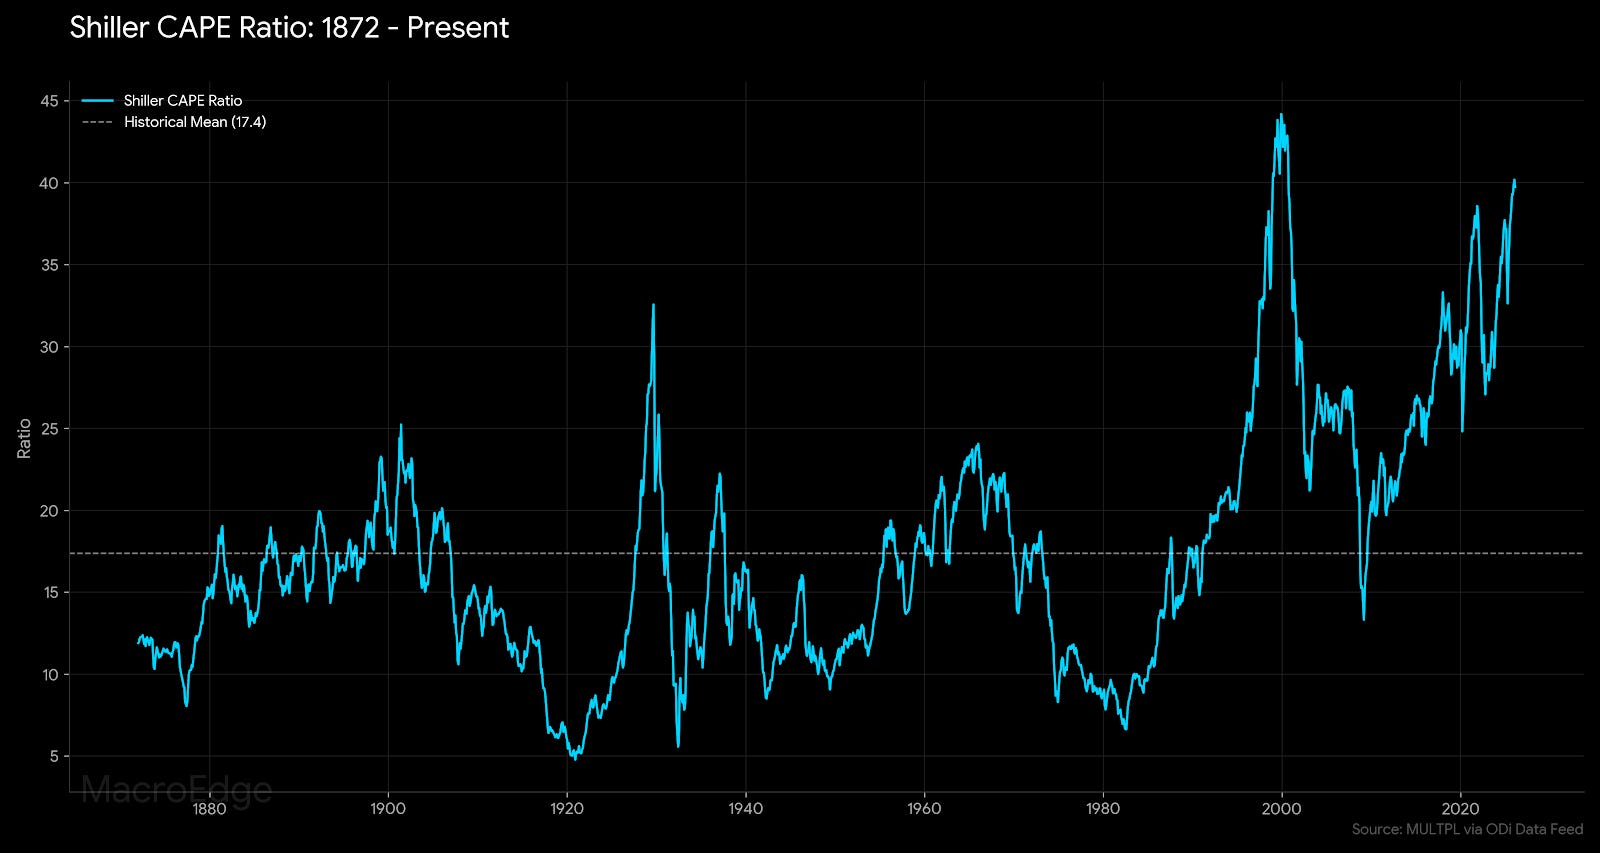
Everything changed in the late 90s under Greenspan and has continued to worsen there from a market bubble standpoint. The age old adage of the stock market is not the economy remains relevant, but they’ve largely tied the two together due to the wealth effect.
Dow = 50K… Ignore All Else?
The Dow Jones became the beacon of market pumping for the Administration, which was very (un)ironically highlighted in the Pam Bondi hearing on the Epstein files. Since then, it’s become a meme and somewhat of a market topping signal. This Administration is shaping up to face Carter levels of unpopularity going into midterms this year (as Six highlights below), and they’ve really struggled to connect with the lower-80% of the i-shaped economy on any positives that have been realized thus far from policy implementation.
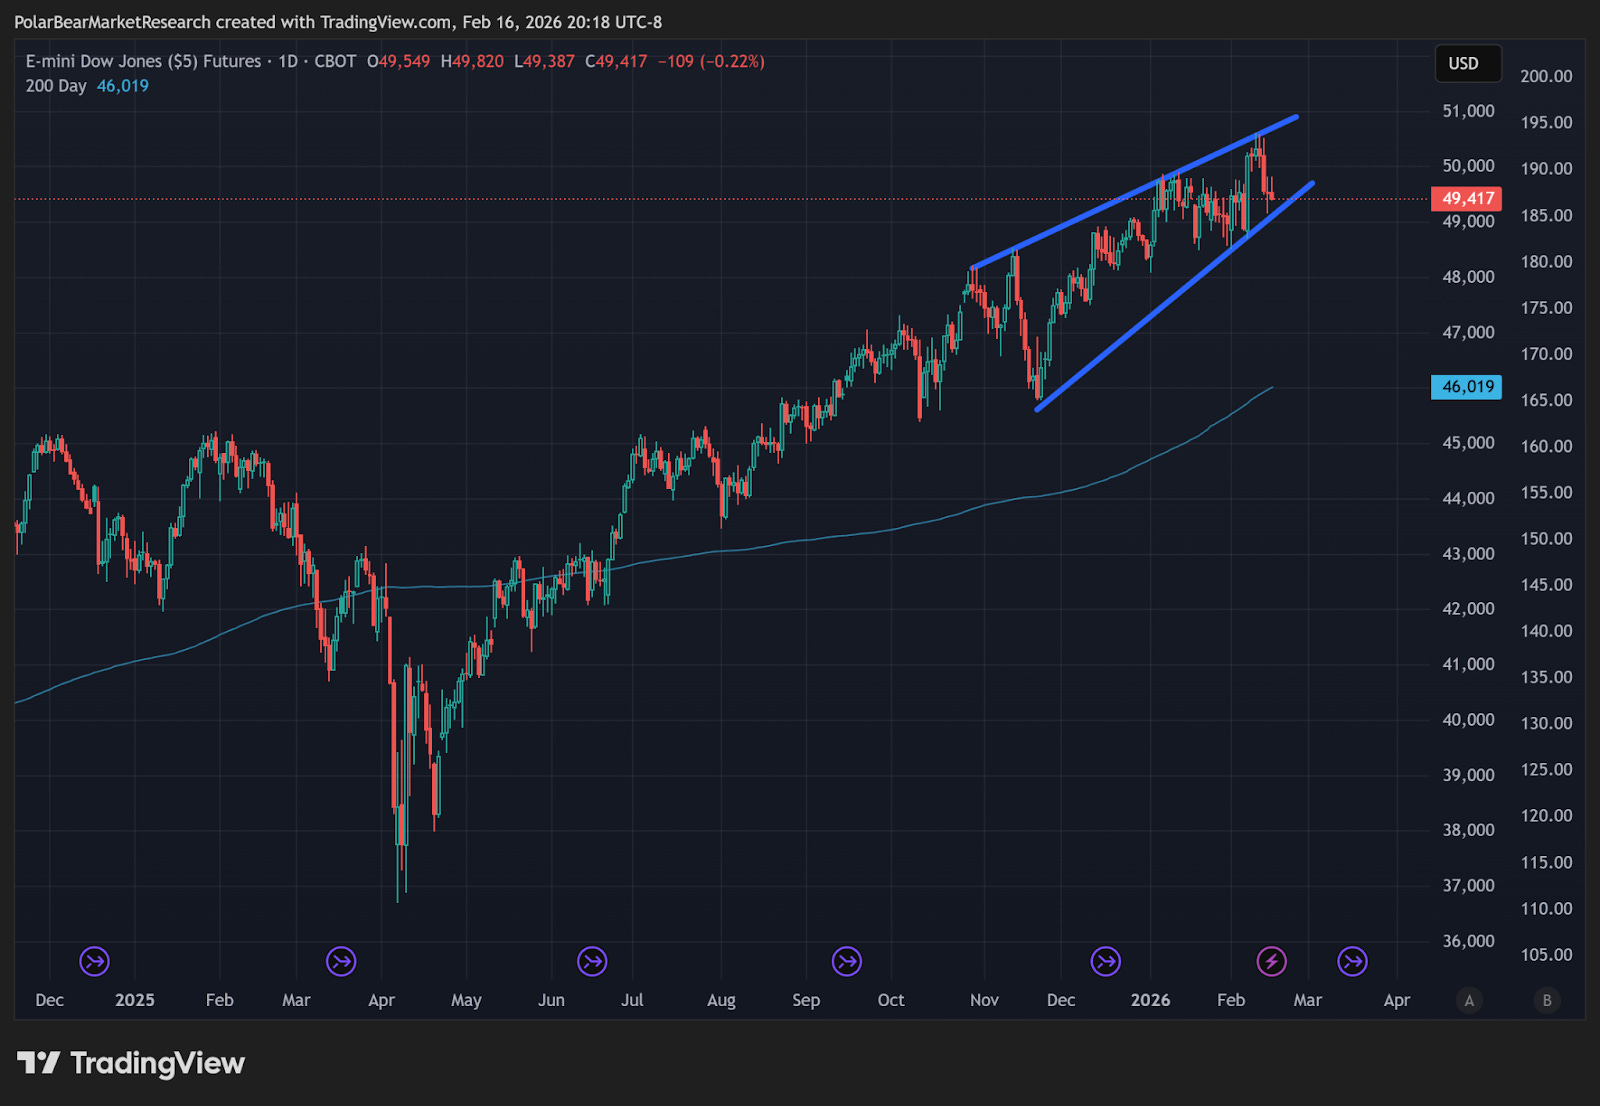
Expanding on an unpopularity standpoint, the stock market messaging is coming at a time in which the indices have lost a lot of momentum from the April TACO-turbocharged lows, and looking at the Nasdaq & S&P, things are in an increasingly precarious place. The idea that one can do no wrong while the stock market moves in a parabolic direction is not one that is going to hold up well with voters, given all of the problems outlined above. No one is willing to absorb any level of pain necessary to start moving things in the right direction - and that means the problems are only going to magnify from here for the Administration.
Trident Update
Below, Six will add coverage with additional portfolio strategy commentary, and discuss midterm impacts on markets and much more. John will also add color to the inflation picture. There’s a lot coming this week - so stay tuned for it all.
In the Midweek Macro Note, I will have an update on Trident and the shape taking form here.

MacroEdge Portfolio Strategy Update - February 16, 2026 (@SixFinance, Head of Research)
Following a generational “let them eat cake” Marie Antoinette moment - AG Pam Bondi’s response to Epstein inquiries stemming from the implication of the president himself, as well as many in his circle of influence, being “the Dow is over 50k” - we should now begin to hone our focus on midterm elections and examine the potential market outcomes.
Major swing issues into this election include: militarization of DHS/ICE, broad affordability concerns, healthcare subsidy removals, broadening wealth gap, and artificial intelligence as both a utility price driver and fear center around future job security.
Since the Civil War, the president’s party has lost House seats in 38 of 41 midterm elections. The rare exceptions (1934, 1998, 2002) were driven by unique national crises or economic booms. (UVA Center for Politics)


While Republicans are currently projected to win in the Senate, the odds are trending against them.

Healthcare appears to be, by a wide margin, the primary beneficiary of a swing towards the left politically in midterms. Healthcare, since 1994, has outperformed SPX by an average of 17% during midterm election years. This year, the stakes are even higher. The Republican-led Congress has allowed the Enhanced Premium Tax Credits to expire, leading to marketplace enrolled healthcare users to see their health insurance costs more than double for those earning above median incomes. Families earning just over 400% of the federal poverty level have seen their premiums increase from a capped 8.5% of income to a multiple of that in many cases. The new structure exposes many families to health insurance costs now being similar to or greater to that of their mortgage payment.
This policy shift has led to lower enrollment among younger, healthier participants, hitting insurers twice. First through enrollment volumes, and then again through a worsening of the risk pool as the most desired customers in the risk pool are more likely to forego the large cost increases and opt to self-insure, hitting the margins of health insurance firms.
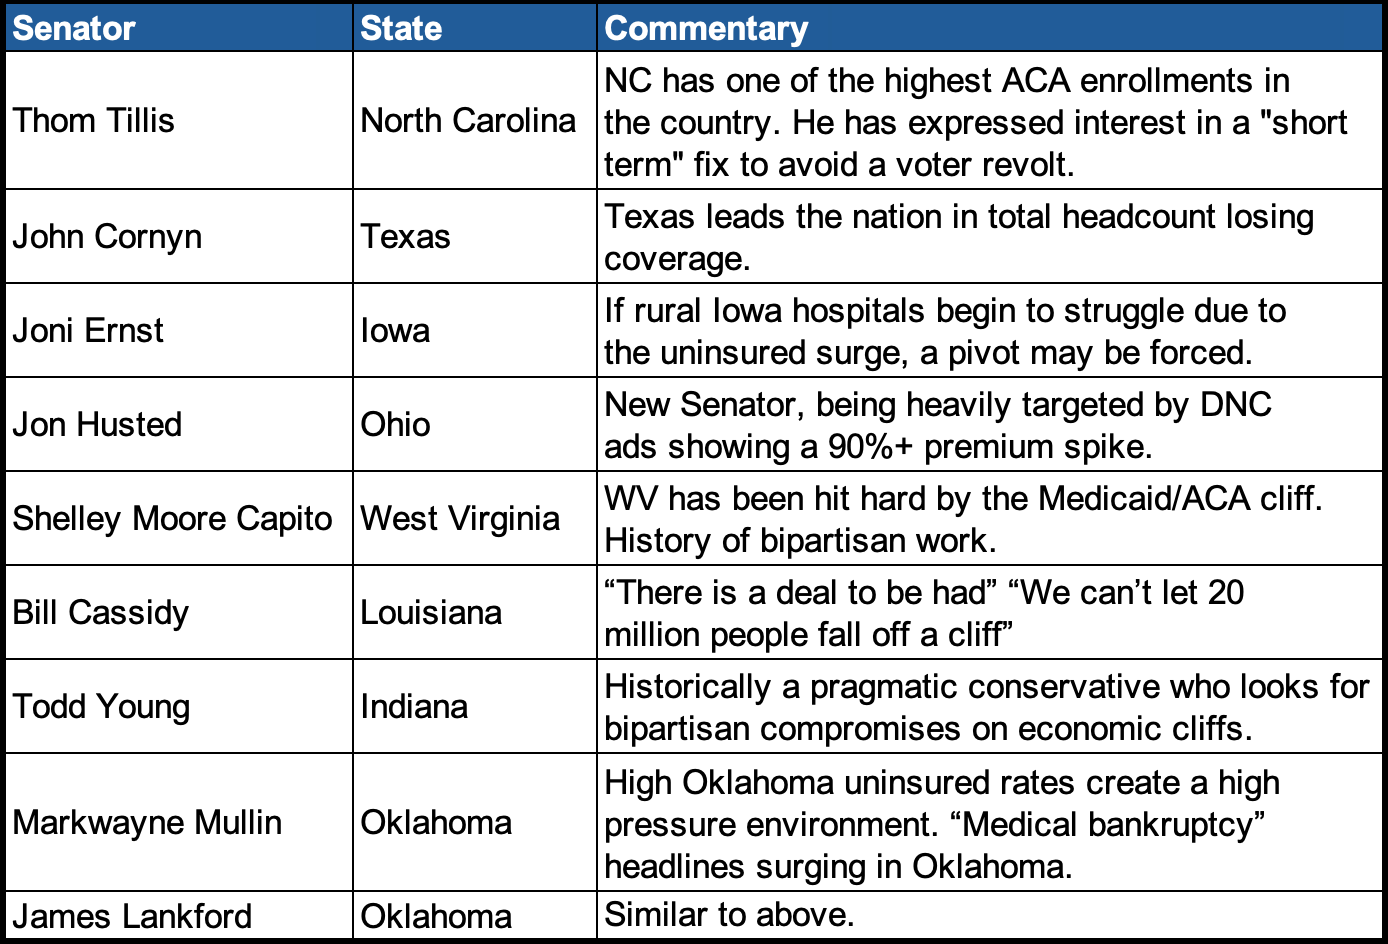
With Republicans shifting marginally away from Trump in recent weeks (6 House Republicans voted to overturn Canada tariffs), Republican self-preservation appears underpriced on healthcare. Democrats already received the votes in the House to extend subsidies, and have a simple majority in the Senate, but not (currently) enough to break the Republican-led Senate filibuster on the issue to force a vote. Senators potentially most exposed to a forced pivot include the below:
Highest beta to any retroactive extensions in subsidies are likely to be found in CNC and OSCR. OSCR is a pure play on ACA subsidies, and CNC is the largest ACA insurer in the marketplace. CNC recently disclosed that they are in danger of losing 2 million members (from 5.5m to 3.5m), if the subsidies are not extended. This makes the subsidies somewhat of a binary event for both insurers, and the risk that goes along with it. Despite subsidy changes, OSCR reported 58%.
YoY membership growth, as the newer insurer aggressively pursued bronze(cheaper, high deductible) and gold plans(expensive, low deductible), pivoting away from middle market silver plans.
OSCR CEO Mark Bertolini, formerly Aetna CEO, has aggressively embraced agentic AI, reporting a 140bps reduction in overhead costs. At 31x NTM P/E, it is far from cheap relative to peers, but at ~$13/share and a FY 2028 EPS projection at $1.86, it represents compelling upside should subsidies come back into play.
CNC, on the other hand, has just “kitchen-sinked” their recent quarter, taking a $6.7bn goodwill impairment charge. Despite this, they guided well above estimates for 2026 ($3 EPS vs $2-2.5 exp). CNC has aggressively raised premiums and is focused on margins. With a majority revenue position stemming from Medicaid over ACA, they are also levered to any upside in a revision of the early position from the administration to increase reimbursement rates by more than the 0.9% YoY that caused a large drawdown across the insurer stocks in recent weeks.
Outside of these two high-beta plays on the insurer sector, a rising tide is still likely to lift all boats, and insurers broadly have likely, in my view, seen enough pain to begin overweighting, which is my plan for midterms. The broad affordability concerns amongst the voter base are simply too large a constraint for politicians to ignore, at least those who want to keep their jobs. I like wide call spreads with at least 18 months to expiration here, and plan to begin putting those on this week. The main risk as I see it is that the downside of policy choices is not fully priced here, but my view is that current stock prices adequately compensate me for this risk.
Oil and Gas
All things equal, a midterm swing in favor of the Democrats is likely to add a meaningful headwind to oil refiners, which have seen a boom in equity valuation on “drill baby drill” and Venezuela tailwinds. It is also likely to be bullish for oil prices should Trump lose the ability to (via lame duck status) set global oil policy via backdoor deals.
If the administration loses its ability to keep oil prices low and contained, it will also add to the case for upside in inflation in the medium term.
Tech and AI
While the Republicans have passed a broad anti-regulatory framework for artificial intelligence that prevents states from regulating AI for the next decade, growing domestic concerns from the populous threaten what is currently a “wild west” atmosphere within AI. The introduction of regulations, specifically those that protect the labor market from big tech, introduces a layer of complexity that caps upside, specifically amongst firms that are deemed most disruptive to the orderly functioning of society. Pure-play AI startups are likely to see increased oversight under this framework, as well as “dirtier” energy producers.

Spamflation (@RealJohnGaltFla, MacroEdge Contributor)
“Leave matters of the state to the state”
This past Friday the Bureau of Labor Statistics released its latest version of the Consumer Price Index and guess what?
It’s still way above the 2% theoretical target of the Federal Reserve.
Did anyone hear that from the financial media? Let’s take a gander as to what was reported:
Consumer prices rose 2.4% annually in January, less than expected
That’s from CNBC so that’s not a shocker, they need you to buy stocks or their very existence comes into question. So promoting all economic data as ‘bullish’ is what one would expect in a headline.
Inflation cooled in January, offering some relief for consumers
This one is from NBC News and while accurate on the surface, is it truly offering “relief” for consumers as the subtitle implicates?
Inflation cooled more than expected in January
That one is from Business Insider, but within the story this statement speaks volumes:
Core CPI, which excludes volatile food and energy prices, rose 2.5% year over year in January, as expected, just below the previous 2.6% increase
At no point do any of the stories reflect that the “core” rate is still above the Federal Reserve’s target of 2%.
Nor do any of the stories reflect an over 35% imputation rate.
Nor does the measurement of health care insurance or medical expenses reflect reality even in alternate Start Trek Universe’s where Spock has a cool beard.

Nor do any of the stories reflect the gaps created by the shutdown where the BLS just declared “shelter” (OER=Owner’s Equivalent Rent) at an impossible 0% inflation level during the shutdown gap.
This brings the doubt forward where one must refer to “alternate” measures of inflation over the longer term, no not Truflation which is more of a short term directional indicator, but embedded or “sticky” measurements that indicate the persistent cost on the middle and lower class of America.
Atlanta Fed Sticky CPI
As my readers know by now, these pages prefer the broader measures used by the Atlanta Federal Reserve Bank via their Sticky CPI measurement. For the month of January, the number indicates the US is still stuck at or above the 3% level:
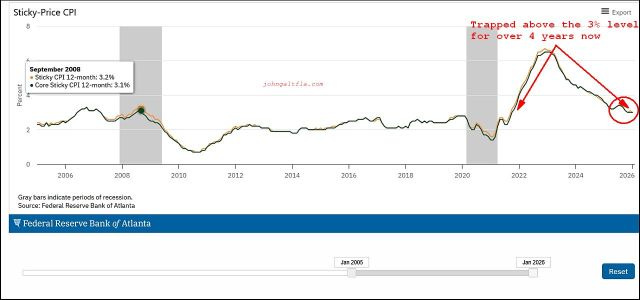
With this persistent level of annualized inflation how bad is it really under the surface if as many websites have documented including this one, that actually consumable goods are averaging annualize price increases far above the reported feel good level reported by the mainstream and financial media?
Let’s take a look at a product which is truly reflective of the impact of tariffs, transportation, and inflationary policies on the American consumer.
Spamflation
Spam is, regardless of one’s personal tastes, America’s economical protein source in times of peace, war, or economic disruption.
To say that inflation is tamed at the consumer level, especially the poor souls residing and trying to survive in the lower leg of the ‘k’ shaped economy, is a lie designed to boost equity prices and investment in Ponzi-like equities to profit the souls smart enough to harvest the greed of the desperate and stupid.
But Spam, America’s canned meat product which rates just higher than grilled Vienna sausages, is the high protein solution created in 1937, still heartily consumed in Hawaii, and enjoyed by those who have a creative ability to create fascinating cuisine with compressed pork shoulder. I personally recommend learning how to make the bacon flavored Spam omelette, but to each their own.
But I digress.
Instead of hammering the BLS for using politically contrived methodology, something these pages have been documenting for 20 years, it’s time to look at a specific product and understand just how tariffs, trade, and the pandemic economic policies of 2020 are still impacting the American consumer.
In August of 2025, the following story appeared on the website, Food Business News:
Hormel Foods struggling to keep pace with rising costs
From this article, the following excerpt highlights just what has hit at the consumer level.
Specific costs highlighted by Smiley included pork bellies, which were up 30% year over year, the pork cutout, which was up 10%, and beef prices, which have reached near all-time highs this year.
“Collectively, we experienced approximately 400 basis points of raw material cost inflation in the third quarter alone, representing a notable increase relative to last year,” Smiley said.
To counter the rising costs, the company raised prices late in its second quarter, is implementing “targeted pricing” during the fourth quarter and is considering additional pricing actions.
“For profitability, we have announced inflation-based pricing actions related to the third-quarter markets, which we expect to partially benefit the fourth quarter and carry into the first quarter of fiscal 2026,” Smiley said. “As the fourth quarter has begun, counter to our expectations, commodity markets have remained elevated across a variety of inputs. With that, we’re assessing additional pricing actions.”
The emphasis is my own because if reflects the cost increases. Interestingly enough, the CEO and others did not include packaging costs for tin or aluminum which are up substantially since 2020:
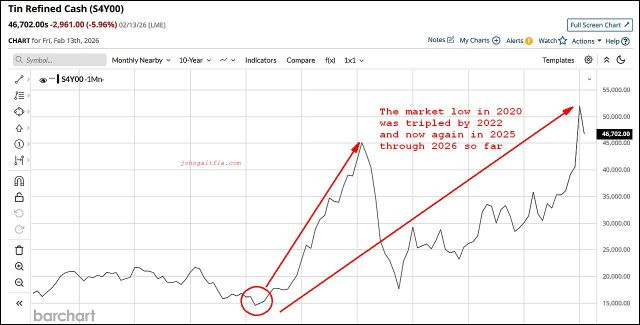
Thankfully (?!) it’s only tripled in price. Yet the American public is led to believe that canned food prices are increasing because of foreign competition, not packaging prices or embedded commodity inflation.
What about aluminum, a primary packaging material used in everything from canned foods to canned beverages?
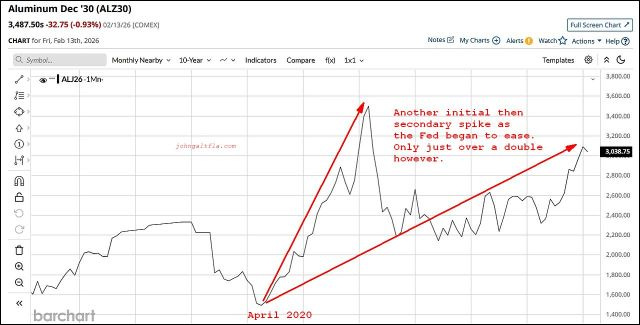
Yet when inflation reports are announced, especially for foodstuffs which the average American consumes on a daily basis, no consideration to these massive price increases is announced, analyzed, or considered.
To be honest, despite the incremental nature of these expenses, why else besides the absurd labor contracts the company signed, would a reduces size of a can of Campbell’s Soup accelerate to $2.00 per can?
So what has this done to Spam, a formerly low cost protein source for the American consumer?
While at my local Publix grocery store today, I snapped this picture of the product in question:
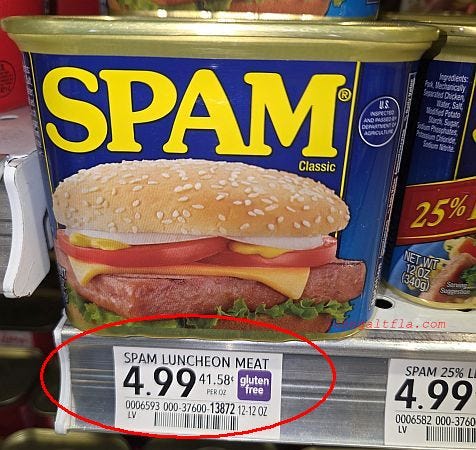
As most visitors and Floridians know, local Publix stores are always substantially higher in price than its competitors, when using this price basis compared to the past, it is up a healthy 41% in just a little over 5 years.
But what about at Walmart, a much more consumer friendly store?
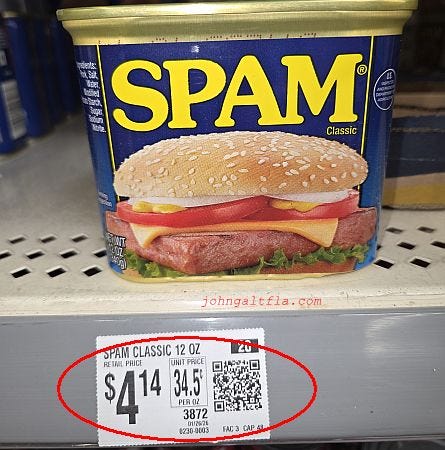
Substantially cheaper than the major grocery chain but still reflective of a product which has almost double in price.
In fact when @Grok was asked to do a cost based analysis on this product, here is what it reported from internet records and prices provided online across the spectrum of grocers which publish such over the 2020-2026 period:
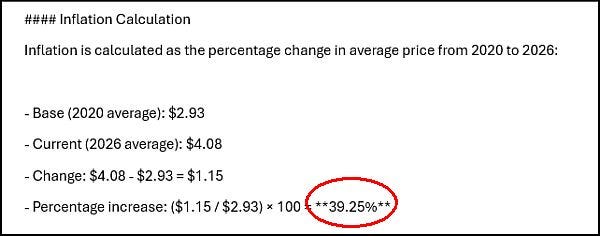
Annualized, this is about 5.7% annually, far, far, above the reported data and worse, way above what the Fed wants us to believe is their target rate. One must remember that despite their legal mandate, their primary assignment is to maintain economic stability by supporting and preventing another “too big to fail” scenario for the major US banks like 2008-2009.
Thus the consumer will be required to pay the price; no matter what.
When one takes consideration of just this product and applies the embedded price across a wide swath of consumer goods, despite an alleged reduction in the annualized rate of inflation, the truth is that actual deflation to return prices to pre-2019 levels is the only solution for the affordability issue.
But do not worry, the official rate of inflation will continue to decline; the government said so.
For those wondering, the quote at the top of this article is from the HBO miniseries Chernobyl.

For more details, please refer to our Terms and Conditions.