


Weekly Macro Note: Real Estate Trends, Homebuilding Equities, CPI Week, Vision Note, Bond Market, Oil, Gappapalooza, & More
In this 6/8 Weekly Macro Note -- the team dives into real estate trends, homebuilding equities, the CPI data ahead of us, opportunities in oil, action in the bond market, gaps galore, and much more.

Good Sunday evening MacroEdge Readers & Community,
Last evening we talked about the May employment situation in our May MacroEdge Labor Market Report and covered widening asymmetry in the oil markets – relative to leading input prices that continue to accelerate. You can read that report below:
In the Midweek Macro Note - we’ll dive more into the upcoming FOMC decision, and why the Fed is likely to continue holding rates. The BoJ interest rate decision also falls not this Monday but the next – and we’ll discuss the CPI report, along with looking at some of the newest regional Fed survey data. The Japanese GDP reading came in as negative for the first quarter – which may cause the BoJ to be additionally tepid on further rate hikes this year. The odds of a hike remain quite likely for at least one this year – but given what’s occurred after the last few, the BoJ is playing with a stick of fire and spinning it (attempting to balance hot inflation and loose monetary policy to support their economy). This evening we’ll dive into:
> Important Macro Data This Week
> Real Estate Trends
> Yield Curve Relationships & Bonds
> CPI This Week - Why it Matters
> Technicals - Where are We? Indices, Energy
Important Macro Data This Week
Monday - Consumer Inflation Expectations, Wholesale Inventories, 3/6 month bond auctions
Tuesday - 52 week bill auction, 3 year auction, API Crude Stock Change
Wednesday - MBA Mortgage Apps, CPI/Core Inflation, EIA Crude Inventory, 17-Week, 10-Year Bond Auction (Oracle earnings)
Thursday - PPI, Jobless Claims, BoJ JGB Purchases
Friday - Michigan Consumer Expectations
Trident & Ozone:
Trident I Global Macro Fund, LP is a fundamentally driven hedge fund currently in development, focused on identifying asymmetric return opportunities across global markets. The strategy is built to capture value from macroeconomic inflection points, market dislocations, and left-tail risk events through extensive research and tactical execution. Learn more about how Trident I is being structured to deliver differentiated performance across asset classes and geographies.
This is a 506(c) offering for accredited investors only.
Access MacroEdge Ozone for two weeks below, and get all of our reports, data, and more:
Real Estate Trends: Single Family Inventory Booms in the Sunbelt & ‘Time to Snipe?’ (@DonMiami3, MacroEdge Chief Economist)
The trends in the Sunbelt continue to be characterized by higher inventory levels. Price softness is mixed in as well – especially in Texas and Florida, and we’ll break down the picture below with more depth. Take a look at the inventory situation in the Sunbelt:

Currently sitting at its highest level since 2012. Individually, Florida saw a slight drop in listings last month - which provides some reprieve for concerned salaries – though in places like Downtown Miami – inventory is sitting as high as 20 months for condos…
Nationally, inventory is at its highest level November 2019, and continues to rise. Inventory usually rises through October/November, meaning we’ve got several months ahead of continued inventory growth – which the Sunbelt will primarily drive.

There’s been a lot of talks about how rate cuts would suddenly breathe life into the lowest sales volumes per capita on record – and while that might be true – there better be a bigger macro catalyst for cuts than we have right now. Trump still has many months until he can install a new Fed Chair who can promise as many cuts as possible (and we’ll soon talk about how this could be another bullish force for inflation).
Price trends in the Sunbelt vary by state – and even moreso down to the local market level. The pictures in Austin and Cape Coral, for example, vary substantially from Jupiter and Southlake, TX.

The real important takeaway is that listing prices for the most part peaked back in 2022, and prices have dipped y/y on a listing basis for the last 2-3 years. While actual close prices are up slightly y/y and are continually pushed out through media channels - the reality is more nuanced, particularly on the new home side of things where buydowns, comps, etc… are far more aggressive.
Cape Coral - Fort Myers – Inventory Hovering Near 13-Year High

Austin Texas - 6 Homes for Sale for Every 1 For Sale After COVID

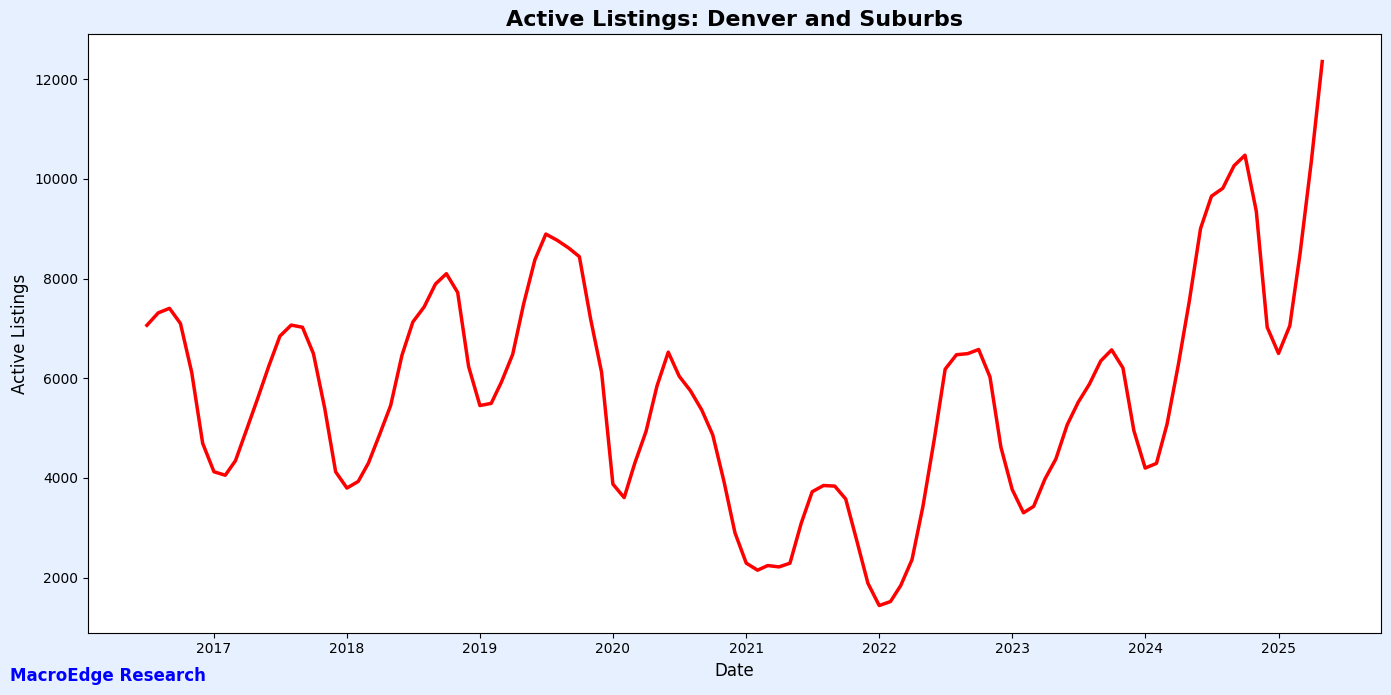
Denver
Phoenix Metro

Miami - Fort Lauderdale - West Palm
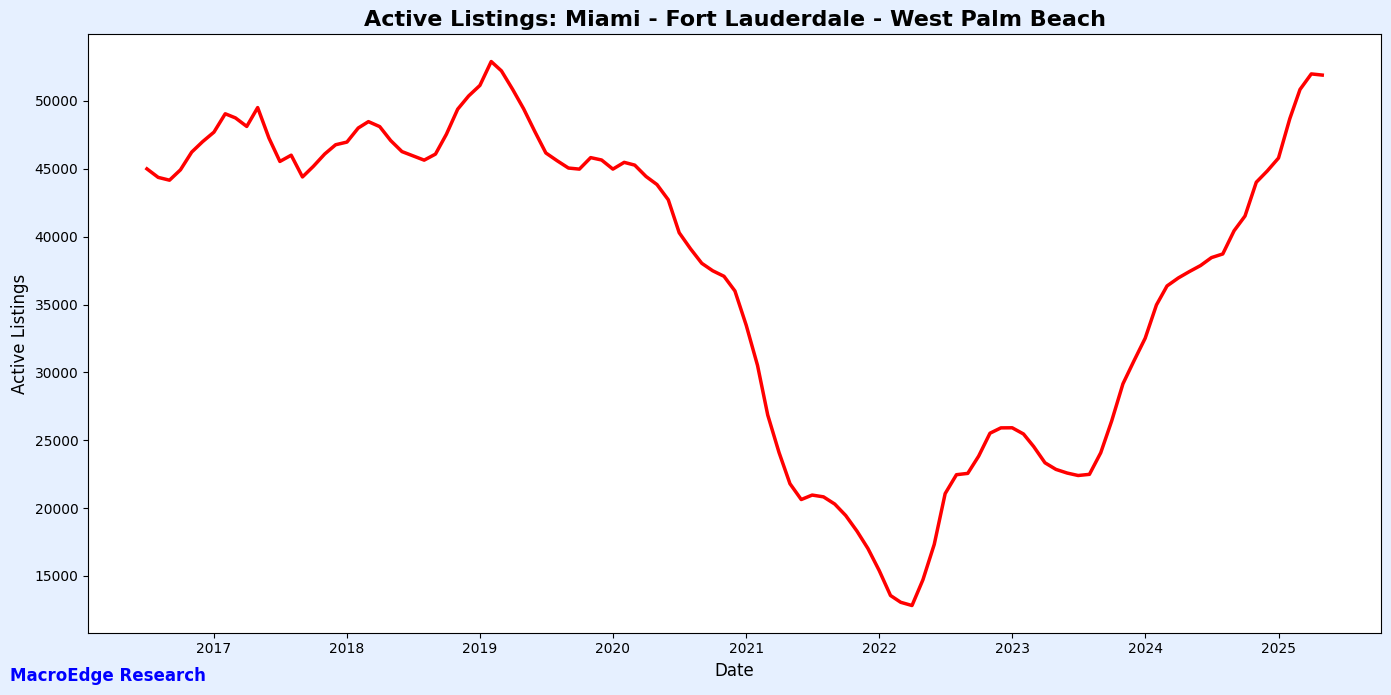
Even though rental inventories are also rising sharply in the Sunbelt - we’re not seeing huge rent softness - though OER continues to cool - and that’s an important component in the CPI reading. The story remains one that we should break down to a local and regional level – because the real estate situation is often much more complex than what national datapoints (especially flawed ones) can capture. For the Sunbelt - there is no home shortage - there is a massive price dislocation causing inventory to rise as much it is - and an increase in transaction volumes might not actually be a positive force for prices like many housing analysts seem to think would be the case.
As for opportunities given these negative headwinds for the homebuilders (of which higher rates may be one, as well) – we can look at the index to identify other signals in the sector. Builders are down over 30%

Builders are tightening in a range here, and the index below 90 would be decisively bearish – not how they’ve lagged the broader market recovery as rates have rebounded (the 10Y back to 4.5%)... much more rate sensitive than the high beta tech names that continue to dominate market concentration. While performance has been negative - the outlook is more mixed - though further acceleration in rates would be very negative for builders - who are starting to see their margins atrophy, and that would eventually hit construction employment more broadly.
Yield Curve Relationships & Bonds
Bonds continue to hover near their cycle lows as yields hover near their cycle highs. If we continue to get this ‘just okay’ data – and the Big Beautiful Bill advances - we can be pretty confident that higher yields are coming, unless U3 begins to spiral higher. Higher yields from here will have a pretty sizeable negative impact on the cyclical rate-sensitive sectors like real estate (that we covered above) and on national debt servicing costs, which currently exceed $1 trillion per year.
Yields and oil are at a potentially major inflection point - and if both break out - we could be looking at a Wave 2 inflation scenario as we’ve seen in past inflationary cycles. Possible catalysts include passing of the Big Beautiful Bill, loose FCI, and the oil bull case that we outlined last night in the Redeye Macro Note.
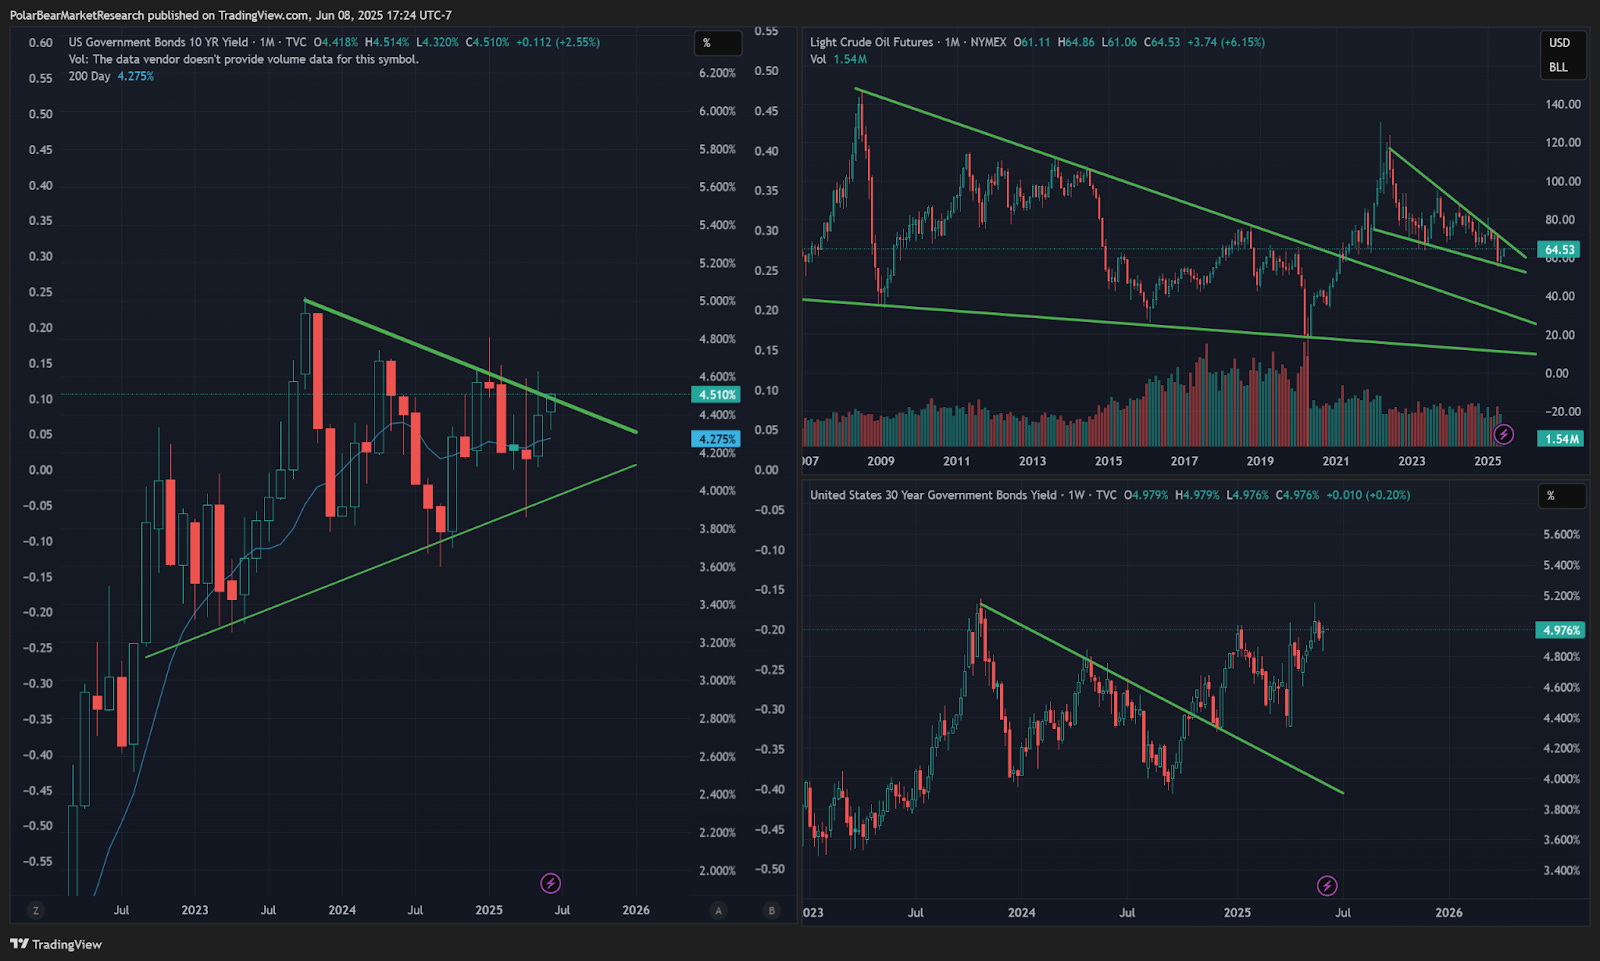
The 2s10s relationship and employment continues to hold – even though employment is evolving very slowly:

Keep reading with a 7-day free trial
Subscribe to MacroEdge to keep reading this post and get 7 days of free access to the full post archives.